- Mark as New
- Bookmark
- Subscribe
- Mute
- Subscribe to RSS Feed
- Permalink
- Report Inappropriate Content
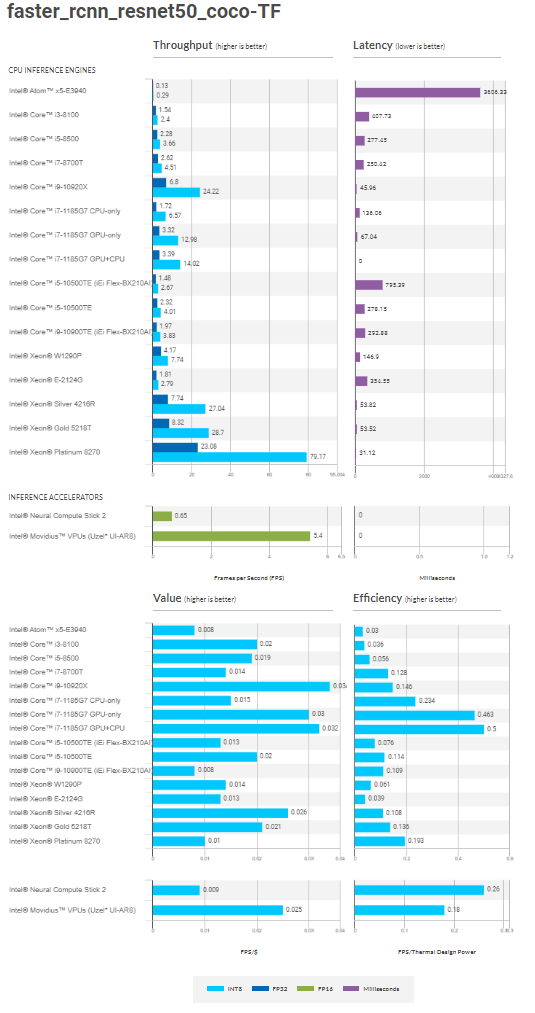
Can someone clarify the graphs here in the performance measures:
https://docs.openvinotoolkit.org/latest/openvino_docs_performance_benchmarks.html
Specifically, the value and efficiency measures. The tooltip says light blue corresponds to INT8 when the NCS2 is only capable of FP16 (Should be green?). If this is not a mistake, can someone please explain why this is so? Thank you
- Tags:
- Documentation
- Mark as New
- Bookmark
- Subscribe
- Mute
- Subscribe to RSS Feed
- Permalink
- Report Inappropriate Content
Hi Damon,
Apologies for the delay in replying to you.
We acknowledge the errors in the Performance Chart, and they have since been corrected and the page has been updated. The Value and Efficiency charts for the Intel Neural Compute Stick 2 are now labeled as green-colored, indicating FP16 precision values.
Thank you for highlighting these errors in our Community.
Regards,
Munesh
Link Copied
- Mark as New
- Bookmark
- Subscribe
- Mute
- Subscribe to RSS Feed
- Permalink
- Report Inappropriate Content
Hi sphrz,
Thanks for reaching out.
Yes, the information on the documentation is correct. The light blue represents the test for INT8, dark blue for FP32, and green is for FP16 format. The table shows the performance result that tested on the listed devices. The value is the performance efficiency or performance-per-cost and the efficiency is a factor to consider when selecting a device to run on a certain workload.
Regards,
Aznie
- Mark as New
- Bookmark
- Subscribe
- Mute
- Subscribe to RSS Feed
- Permalink
- Report Inappropriate Content
Thank you for your response.
I understand what the metrics meanings are a bit better now. However, I am still unsure why the Value and Efficiency charts for the Intel Neural Compute Stick 2 is labeled as light blue (INT8). In the chart above (Throughput and Latency) they are colored green indicating that the values are from the FP16 precision but now the Value and Efficiency charts shown as INT8 precision as the metric?
Ultimately, what changed to make the Value and Efficiency INT8 (light blue) since the lowest the stick can infer on is FP16?
Thank you
- Mark as New
- Bookmark
- Subscribe
- Mute
- Subscribe to RSS Feed
- Permalink
- Report Inappropriate Content
Hi Damon,
Apologies for the delay in replying to you.
We acknowledge the errors in the Performance Chart, and they have since been corrected and the page has been updated. The Value and Efficiency charts for the Intel Neural Compute Stick 2 are now labeled as green-colored, indicating FP16 precision values.
Thank you for highlighting these errors in our Community.
Regards,
Munesh
- Mark as New
- Bookmark
- Subscribe
- Mute
- Subscribe to RSS Feed
- Permalink
- Report Inappropriate Content
- Mark as New
- Bookmark
- Subscribe
- Mute
- Subscribe to RSS Feed
- Permalink
- Report Inappropriate Content
Hi Damon,
This thread will no longer be monitored since this issue has been resolved. If you need any additional information from Intel, please submit a new question.
Regards,
Munesh
- Subscribe to RSS Feed
- Mark Topic as New
- Mark Topic as Read
- Float this Topic for Current User
- Bookmark
- Subscribe
- Printer Friendly Page