Intel® Fortran Compiler
Build applications that can scale for the future with optimized code designed for Intel® Xeon® and compatible processors.

False sharing in subroutine head

mriedman
Novice
826 Views

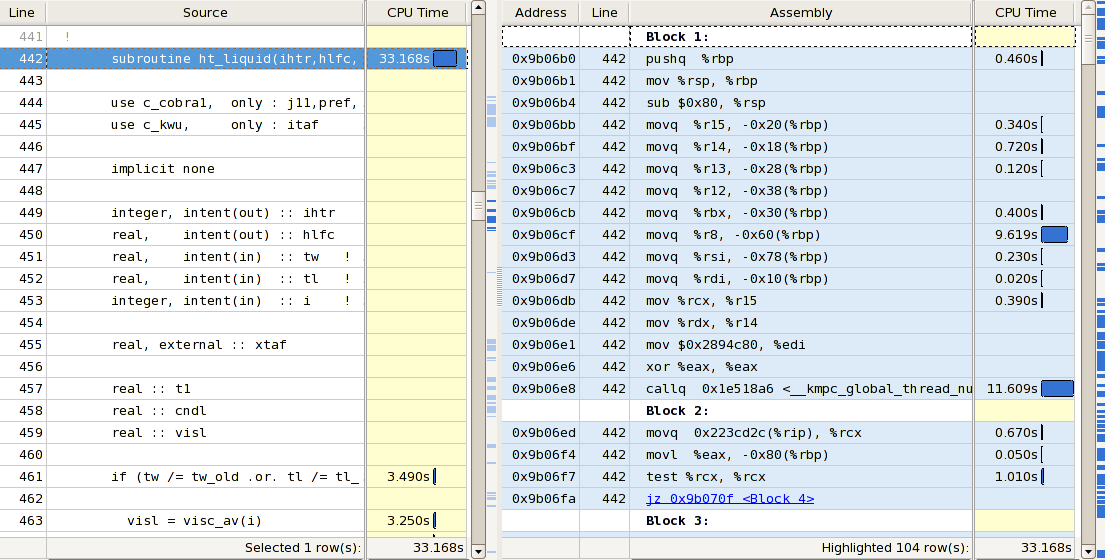
Benchmarking of an OpenMP code on a WestmereEX machine (40 cores) has exposed another instance of what I believemust befalse sharing. In this special case the problem appears to be out of direct control as it is located in the head of a subroutine, where the arguments are loaded. The subroutine takes 11 scalar arguments, 3 of them are output, the rest is input.

The assembly output of oprofile looks as follows:

[plain]00000000009a1740 : /* htran_ total: 1413945 27.5838 */ 889 0.0173 : 9a1740: push %rbp 23 4.5e-04 : 9a1741: mov %rsp,%rbp : 9a1744: sub $0x190,%rsp 890 0.0174 : 9a174b: mov %r15,0xfffffffffffffff0(%rbp) 40 7.8e-04 : 9a174f: mov %r14,0xffffffffffffffe8(%rbp) 149 0.0029 : 9a1753: mov %r13,0xffffffffffffffe0(%rbp) 29 5.7e-04 : 9a1757: mov %r12,0xffffffffffffffd8(%rbp) 859 0.0168 : 9a175b: mov %rbx,0xffffffffffffffd0(%rbp) 6636 0.1295 : 9a175f: mov %r8,%r15 : 9a1762: mov %rcx,%r13 : 9a1765: mov %rdx,%rbx 838 0.0163 : 9a1768: mov %rsi,%r12 41 8.0e-04 : 9a176b: mov %rdi,%r14 1150994 22.4541 : 9a176e: mov 0x10(%rbp),%rsi 148301 2.8931 : 9a1772: cmpl $0x0,(%rsi) 1465 0.0286 : 9a1775: movl $0x3e8,0xfffffffffffffff8(%rbp) 58710 1.1453 : 9a177c: je 9a1b18 [/plain]


The last mov instruction has an enormous amount of profile samples. Using fewer threads the sample percentage decreases which is typical for false sharing.
The question is how false sharing can occur on the stack of a thread and what can be done to avoid it.


0 Kudos
9 Replies
jimdempseyatthecove
Honored Contributor III
826 Views
The prior mov instructions are writes to the local stack variables to save registers and register to register mov's. These writes have no pipeline dependencies and therefore the pipeline need not stall waiting for the writes to complete (also the processor can perform write combining to the same cache line). The final mov is a read of one of the passed arguments (last one pushed in the call). This mov, being a read, immediatly followed by a test for the returned value will cause the pipeline stall waiting for the results (presumably from L1 cache since it was written immediately prior to the call).

You should expect higher hit counts for reads immediately followed by use (read to %rsi, immediately use %rsi). This stall is not necessarily false sharing.

In counting the ticks before the last mov we fine ~10000 ticks. The last mov has ~115x the number of ticks. Which would indicate that the read is not pulling from L1 cache.

Is there something you haven't told us relating to this function and what calls the function?

a) is this function located in O/S space requiring a thunk to transition from user space to O/S space?
b) is another thread on the processor, perhaps HT sibling, issuing serialization instructions (e.g. CPUID, RDTSC, ...)?
c) have you enabled one of the VTune options that track call tree information? (this may flush cache)

Jim Dempsey
0 Kudos
mriedman
Novice
826 Views
thanks, Jim, meanwhile I ran that case with VTune.For that code section VTune exposes high event counts of resource_stalls.store and ild_stall.iq_full

I still believe it must be a cache related issue. The machine has 10 cores per socket. When running 8 to 10 threads on the same socket things are fine. As soon as I go across the socket boundary (e.g. from 10 to 12 cores) the runtime in this routine roughly doubles. And it more than doubles again when the third socket is involved.

BTW all your questions above can be answered with "no".

0 Kudos
jimdempseyatthecove
Honored Contributor III
826 Views

115099422.4541:9a176e:mov0x10(%rbp),%rsi
1483012.8931:9a1772:cmpl$0x0,(%rsi)

The first statement above is copying what was the last argument pushed onto the stack into %rsi, which looks as if it is a reference to a variable. The second statement is testing the memory location pointed to by the reference (%rsi) against 0.

The first statement should expect to see no worse than L1 latency (typically 4 clock ticks), unless the memory port is stalled with the 5 writes to 0xoffset(%rbp). Direct read from memory of local processor is ~64 clocks, across NUMA node will add a few more per hop (in your case only 1 hop could possibly beinvolved).

What is this argument? (tell me the 1st and last argument)

Would this happen to be a shared, volatile, and high contention variable?

Jim Dempsey

0 Kudos
mriedman
Novice
826 Views
Finally doing further investigation on this matter. The initial observation is now confirmed with VTune as well: Getting an enormous number of samples annotated to the subroutine head. In the screenshot below that is about 50% of the total time for that routine. Meanwhile it seems like the symptom is related to the use of scalar persistent variables (either local or module scope) that are attributed as $omp threadprivate. These appear to introduce quite some overhead by hidden function calls to __kmpc_threadprivate_cached and __kmpc_global_thread_num. So the question is whether this is a known issue with known workarounds ? Any documentation around ? Besides that I would hope that the compiler allocates threadprivate persistent variables in a way that avoids false sharing. Can anybody confirm that ? One thing to try with ifort 11.1 is -openmp-threadprivate compat in order to change this whole mechanism. However that requires a total rebuild. Will post the results next year ;-) Michael
0 Kudos
jimdempseyatthecove
Honored Contributor III
826 Views
>>that are attributed as $omp threadprivate. ...known issue with known workarounds One way to reduce the number of calls to __kmpc_threadprivate_cached and __kmpc_global_thread_num is by creating a user defined type containing the items desired in thread private, then declaring a thread private value of that type (or having a thread private allocatable of that type or pointer to that type and allocate to that allocatable/pointer). Then reduce the number of the calls to these functions by "lifting" the thread private reference to and outer level then passing the reference back down the call tree. This assumes that the inner level(s) are called from a loop in the outer level. Jim Dempsey
0 Kudos
jimdempseyatthecove
Honored Contributor III
826 Views
I think thread private issues (performance) could have been fixed a long time ago with a little inventive programming (at least on x86 platforms). The segment registers FS and GS could be claimed for use as thread private. FS could map the application known (compile and link time) thread private data GS could map a DLL (shared library) thread private area. This would permit app code to have thread private data (and not access DLL thread private data) This would permit a DLL to create DLL known thread private data for an app as well as access app thread private data However, this would not permit a DLL to directly reference a different DLL's thread private data. The DLL on entry would have to save the current GS then locate the approperiate thread GS value (one time issue per DLL call), then restore GS on exit. The LOC(x) of a thread private variable would return the DS virtual address (as opposed to the offset to FS/GS), the overhead of this is a register mov then add. With this, then the cost of referencing a thread private variable would be the cost of using the segment override prefix (neglegable). Making this change now may be difficult. Jim Dempsey
0 Kudos
TimP
Honored Contributor III
826 Views
An issue which has arisen in the past with pushing arguments on the stack is with the limit on number of fill buffers (10). If a loop stores to more than 9 cache lines, including cache lines used for pushing arguments as well as explicit assignments, you are likely to see stalls associated with flushing buffers so as to make them available for allocation to a new cache line with "read for ownership" (where the current contents of the cache line are copied into the buffer). The old-fashioned cure is either to push the inner loop inside the subroutine, or to engage inter-procedural optimization, perhaps using force inline directives.
0 Kudos
mriedman
Novice
826 Views
thanks a lot, Jim & Tim. Finally I got a rough idea what's happening here. Indeed the routine is called very frequently, being located inside nested loops. Due to the number of local and global variables being accessed, 9 cache lines are easily exceeded. I'll try to lift it to the next loop level. Michael
0 Kudos
jimdempseyatthecove
Honored Contributor III
826 Views
The other thing you can do is a variation on TimP's suggestion. In the one-up level loop's one-up level loop, create a struct that packages the arguments to the one-up level loop. Then tweek the contents of this struct as necessary in the one-up level loop. Then pass the pointer (reference) to the struct to the inner most level loop. This will reduce the number of writes per call to the inner level loop. The struct reference may be registerized, and equally important, the unchanging values within the struct do not need to be written (well actually the references to these values need not be pushed onto the stack). Jim Dempsey
0 Kudos
Reply