- Mark as New
- Bookmark
- Subscribe
- Mute
- Subscribe to RSS Feed
- Permalink
- Report Inappropriate Content
- file structure.pdf
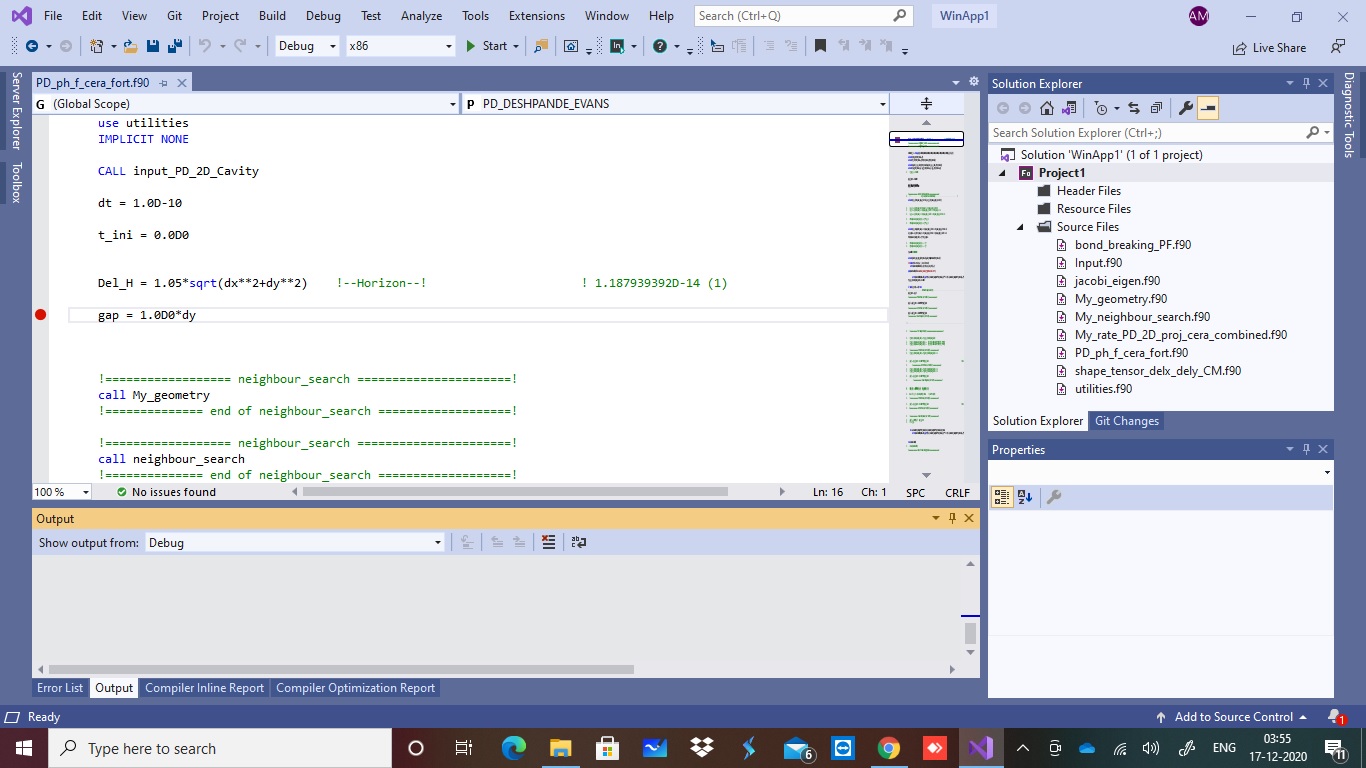
- snapshot of the microsoft visual studio screen before pressing start button.jpeg
- snapshot of the microsoft visual studio screen after pressing start button with debug mode.jpeg
- Mark as New
- Bookmark
- Subscribe
- Mute
- Subscribe to RSS Feed
- Permalink
- Report Inappropriate Content
Why are you installing the beta? The oneAPI HPC toolkit (with Fortran) is released.
Link Copied
- Mark as New
- Bookmark
- Subscribe
- Mute
- Subscribe to RSS Feed
- Permalink
- Report Inappropriate Content
That the variable name shows as lowercase tells me that the Fortran debug integration isn't being used. Try an uninstall and reinstall of the Intel compiler.
- Tags:
- That
- Mark as New
- Bookmark
- Subscribe
- Mute
- Subscribe to RSS Feed
- Permalink
- Report Inappropriate Content
After re-installing Intel Fortran compiler(Intel Fortran Compiler(Beta) for Windows), the same problem exists. I have installed the following files apart from Microsoft visual studio 2019 to run and debug my Fortran code from the site (https://software.intel.com/content/www/us/en/develop/articles/oneapi-standalone-components.html#fortran
- Intel Fortran Compiler(Beta) for Windows
- Intel Open Volume Kernel Library for Windows
- Intel openAPI Math Kernel Library for Windows
- Intel oneAPI Data Analytics Library for Windows
- Intel Inspector for Windows
I have downloaded all files from installer 'Local'.
Can you please tell me that all the files mentioned above are required to install or not to watch the value in debugging mode? And also guide me if any other files are needed to be installed from any other source to solve my purpose.
- Mark as New
- Bookmark
- Subscribe
- Mute
- Subscribe to RSS Feed
- Permalink
- Report Inappropriate Content
Why are you installing the beta? The oneAPI HPC toolkit (with Fortran) is released.
- Mark as New
- Bookmark
- Subscribe
- Mute
- Subscribe to RSS Feed
- Permalink
- Report Inappropriate Content
After installing oneAPI HPC Toolkit with openAPI Base Toolkit, my problem has resolved. Thanks!
- Mark as New
- Bookmark
- Subscribe
- Mute
- Subscribe to RSS Feed
- Permalink
- Report Inappropriate Content
I have the same problem. I can not get the debug watch information.
I have installed the toolkit

My visual studio version is 2019 version 16.8.4.
See the below. I create a simple program, but I cannot watch the information.

- Mark as New
- Bookmark
- Subscribe
- Mute
- Subscribe to RSS Feed
- Permalink
- Report Inappropriate Content
- Mark as New
- Bookmark
- Subscribe
- Mute
- Subscribe to RSS Feed
- Permalink
- Report Inappropriate Content
the problem is solved for now after I unstall and reinstall everything, VS, base and Hpc.
- Mark as New
- Bookmark
- Subscribe
- Mute
- Subscribe to RSS Feed
- Permalink
- Report Inappropriate Content
I have the same problem after I installed oneAPI. Does it really the only solution to install again everything?
- Mark as New
- Bookmark
- Subscribe
- Mute
- Subscribe to RSS Feed
- Permalink
- Report Inappropriate Content
I have the same issue with recently installed (upgraded from 2019) MVSC 2022, Intel Fortran compiler 2023. I also installed the Intel oneAPI HPC Toolkit with openAPI Base Toolkit. When I scroll over variables during debugging I used to see the values in MVSC 2019, now nothing is shown. Screenshot of Locals below:

- Mark as New
- Bookmark
- Subscribe
- Mute
- Subscribe to RSS Feed
- Permalink
- Report Inappropriate Content
Hi Rick,
same trouble here. Have you solved the problem?
thanks.
Wen
- Mark as New
- Bookmark
- Subscribe
- Mute
- Subscribe to RSS Feed
- Permalink
- Report Inappropriate Content
It was helpful to set the compiler optimization option as Disable.
: Solution explorer -> Fortran project -> Properties -> Fortran -> Optimization
With options like /O3, breaking points worked, but values of variables were not available for watch.
- Mark as New
- Bookmark
- Subscribe
- Mute
- Subscribe to RSS Feed
- Permalink
- Report Inappropriate Content
Is your call stack in the focus of the procedure with those variables?
IOW, if your procedure with those variables, called a library procedure, and that errored .AND. EPS1 and EPS2 were global variables, then you might see what you have shown.
Jim Dempsey
- Subscribe to RSS Feed
- Mark Topic as New
- Mark Topic as Read
- Float this Topic for Current User
- Bookmark
- Subscribe
- Printer Friendly Page