- Marcar como nuevo
- Favorito
- Suscribir
- Silenciar
- Suscribirse a un feed RSS
- Resaltar
- Imprimir
- Informe de contenido inapropiado
Hello,
After installing Intel Parallel Studio XE Composer Edition for Fortran Windows 2015, I notice that debugging C# is flawed in Visual Studio 2015 Enterprise Edition.
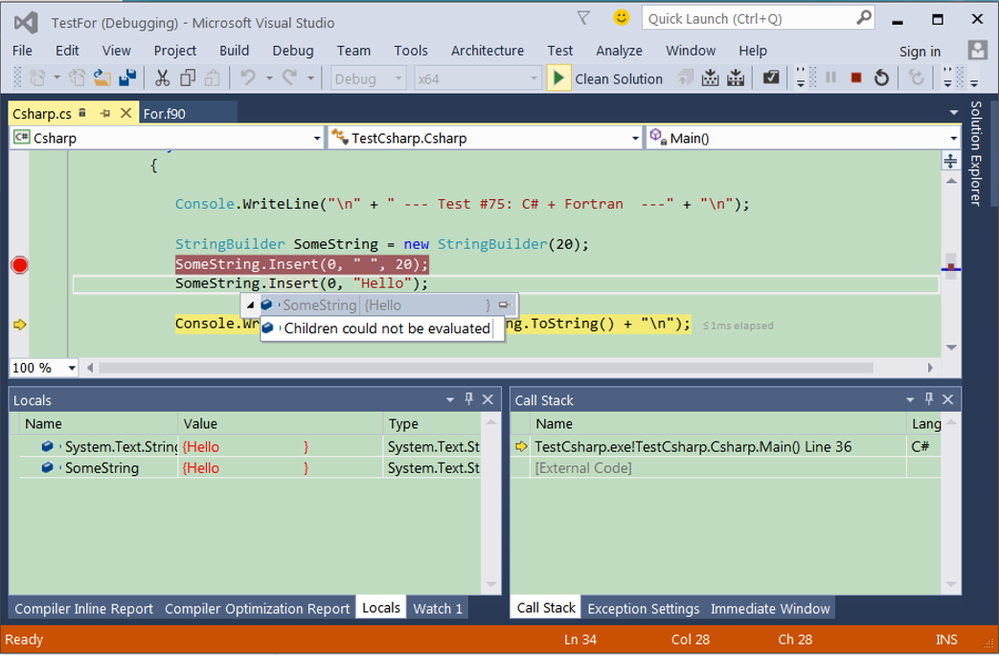
The problem is that during debugging objects cannot be watched fully any more. More specific, when hitting a breakpoint and setting a watch on a complex C# object, it is no longer possible to view details of this object by expanding the tree structure of this object. When hovering over the object in the code window and expanding the tree icon, it says: "Children could not be evaluated".
Uninstalling Studio XE Composer Edition 2015 brings back full debug support in C#.
BTW, the problem does not occur in Visual Studio 2013.
Does anyone have a solution for this problem? Thanks a lot.
Best regards
Luc
- Etiquetas:
- Intel® Fortran Compiler
Enlace copiado
- Marcar como nuevo
- Favorito
- Suscribir
- Silenciar
- Suscribirse a un feed RSS
- Resaltar
- Imprimir
- Informe de contenido inapropiado
Luc would it be possible to get a reproducing test case that our Debugger team could use to investigate this further?
From what investigation you have already done it sounds like there may be something related to our compiler/debugger integrations into Visual Studio 2015.
- Marcar como nuevo
- Favorito
- Suscribir
- Silenciar
- Suscribirse a un feed RSS
- Resaltar
- Imprimir
- Informe de contenido inapropiado
- Marcar como nuevo
- Favorito
- Suscribir
- Silenciar
- Suscribirse a un feed RSS
- Resaltar
- Imprimir
- Informe de contenido inapropiado
Thank you Luc. I'll post again when I know more.
- Marcar como nuevo
- Favorito
- Suscribir
- Silenciar
- Suscribirse a un feed RSS
- Resaltar
- Imprimir
- Informe de contenido inapropiado
I have the same problem with VS2015 Enterprise and IVF 16.
This is really annoying, as we need both Fortran and C#. Hope there will be a quick fix.
Best regards,
Thomas
- Marcar como nuevo
- Favorito
- Suscribir
- Silenciar
- Suscribirse a un feed RSS
- Resaltar
- Imprimir
- Informe de contenido inapropiado
Hello,
I've taken the incident from Kevin and forwarded the issue to our FEE (debugger) engineers. At first glance they think it could be caused by the FEE add-in. Further investigation is ongoing. I'll send an update once I have more information for you.
Best regards,
Georg Zitzlsberger
- Marcar como nuevo
- Favorito
- Suscribir
- Silenciar
- Suscribirse a un feed RSS
- Resaltar
- Imprimir
- Informe de contenido inapropiado
Hello,
as a workaround you might turn off FEE manually by:
Renaming ForDbgSW.dll (Microsoft Visual Studio 2015* installation; \Common7\Packages\Debugger\ForDbgSW.dll) to DONTUSE_ForDbgSW.dll. Please do that only with VS closed. Afterwards, start VS again and try to debug the C# application.
If you want do debug Fortran applications you need to wait for a fix (engineering is just working on that for the next update) or rename the DLL back.
Best regards,
Georg Zitzlsberger
- Marcar como nuevo
- Favorito
- Suscribir
- Silenciar
- Suscribirse a un feed RSS
- Resaltar
- Imprimir
- Informe de contenido inapropiado
- Marcar como nuevo
- Favorito
- Suscribir
- Silenciar
- Suscribirse a un feed RSS
- Resaltar
- Imprimir
- Informe de contenido inapropiado
- Marcar como nuevo
- Favorito
- Suscribir
- Silenciar
- Suscribirse a un feed RSS
- Resaltar
- Imprimir
- Informe de contenido inapropiado
- Marcar como nuevo
- Favorito
- Suscribir
- Silenciar
- Suscribirse a un feed RSS
- Resaltar
- Imprimir
- Informe de contenido inapropiado
My experience is that the OpenValidateX message is harmless - I see it often. Are you saying it creates a problem?
- Marcar como nuevo
- Favorito
- Suscribir
- Silenciar
- Suscribirse a un feed RSS
- Resaltar
- Imprimir
- Informe de contenido inapropiado
- Marcar como nuevo
- Favorito
- Suscribir
- Silenciar
- Suscribirse a un feed RSS
- Resaltar
- Imprimir
- Informe de contenido inapropiado
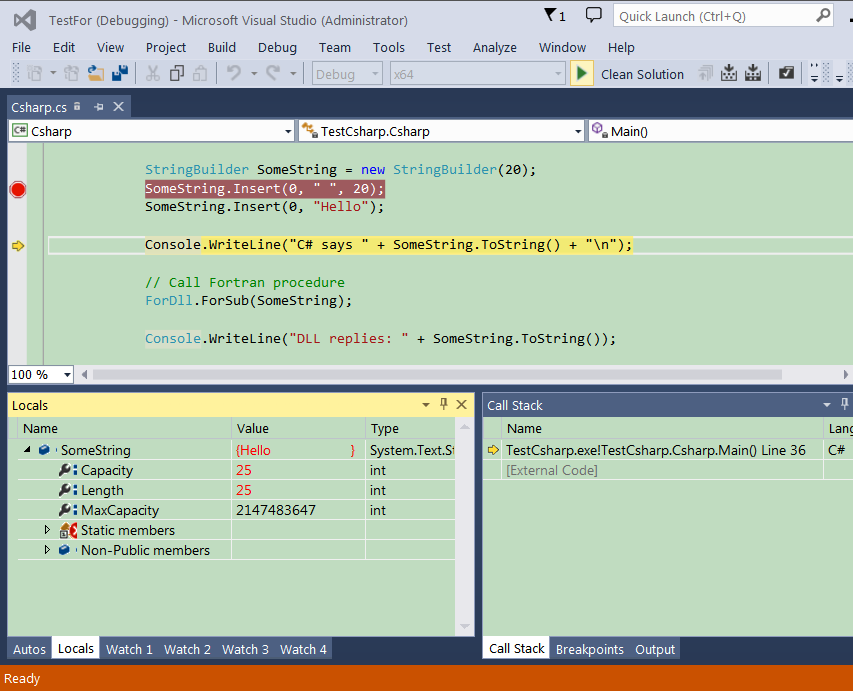
FWIW, here's a third data point: I too have this problem. Here're some screen images to concur with the issue presented by OP.
With VS 2015:
whereas the same exact debug step for the same code and the same VS solution file works with VS 2013:
This will preclude us from upgrading to VS 2015.
- Marcar como nuevo
- Favorito
- Suscribir
- Silenciar
- Suscribirse a un feed RSS
- Resaltar
- Imprimir
- Informe de contenido inapropiado
Hello,
some investigation update to provide you the big picture:
- It seems to occur with Intel(R) Parallel Studio XE 2015 Update 4 and later as well as the new Intel(R) Parallel Studio XE 2016.
- Impacted version is Microsoft Visual Studio 2015* but we also can internally reproduce it for 2013.
The only workaround known so far is to rename <VS-dir>\Common7\Packages\Debugger\FEE.dll to avoid loading it. This disables evaluation of Fortran expressions when debugging Fortran applications.
Engineering is currently working on it and further updates about the problem will be posted here.
Best regards,
Georg Zitzlsberger
- Marcar como nuevo
- Favorito
- Suscribir
- Silenciar
- Suscribirse a un feed RSS
- Resaltar
- Imprimir
- Informe de contenido inapropiado
Hello,
there is an alternative workaround that enables debugging of C# and Fortran applications at the same time (with some caveats* though):
Reverting to the legacy debug engine from Microsoft Visual Studio* by selecting "Managed Compatibility Mode".
More details can be found here:
http://blogs.msdn.com/b/visualstudioalm/archive/2013/10/16/switching-to-managed-compatibility-mode-in-visual-studio-2013.aspx
Best regards,
Georg Zitzlsberger
*): There are caveats selecting the "Managed Compatibility Mode". Microsoft* placed the following disclaimer:
Enabling Managed Compatibility Mode will disable many features that depend on the current debugger implementation to operate. It is our goal in the future to completely remove the legacy engine from the product and hence remove the options discussed later in this blog post.
Hence, please expect some debugger features or even other integrations to fail if you enable the "Managed Compatibility Mode".
- Marcar como nuevo
- Favorito
- Suscribir
- Silenciar
- Suscribirse a un feed RSS
- Resaltar
- Imprimir
- Informe de contenido inapropiado
Wow, this is a pretty epic slip up as far as product updates go. I'm hoping you're planning to push an update ASAP, because this is beyond critical!
- Marcar como nuevo
- Favorito
- Suscribir
- Silenciar
- Suscribirse a un feed RSS
- Resaltar
- Imprimir
- Informe de contenido inapropiado
Hello,
with Intel(R) Parallel Studio XE 2016 Update 1 planned to be released around first week of November this problem will be resolved.
Thank you for reporting!
Best regards,
Georg Zitzlsberger
- Suscribirse a un feed RSS
- Marcar tema como nuevo
- Marcar tema como leído
- Flotar este Tema para el usuario actual
- Favorito
- Suscribir
- Página de impresión sencilla


Hello,
Thank you for the confirmation! I'll update this thread and the Intel(R) Premier Support tickets once I have more information from engineering.
Best regards,
Georg Zitzlsberger