- Mark as New
- Bookmark
- Subscribe
- Mute
- Subscribe to RSS Feed
- Permalink
- Report Inappropriate Content
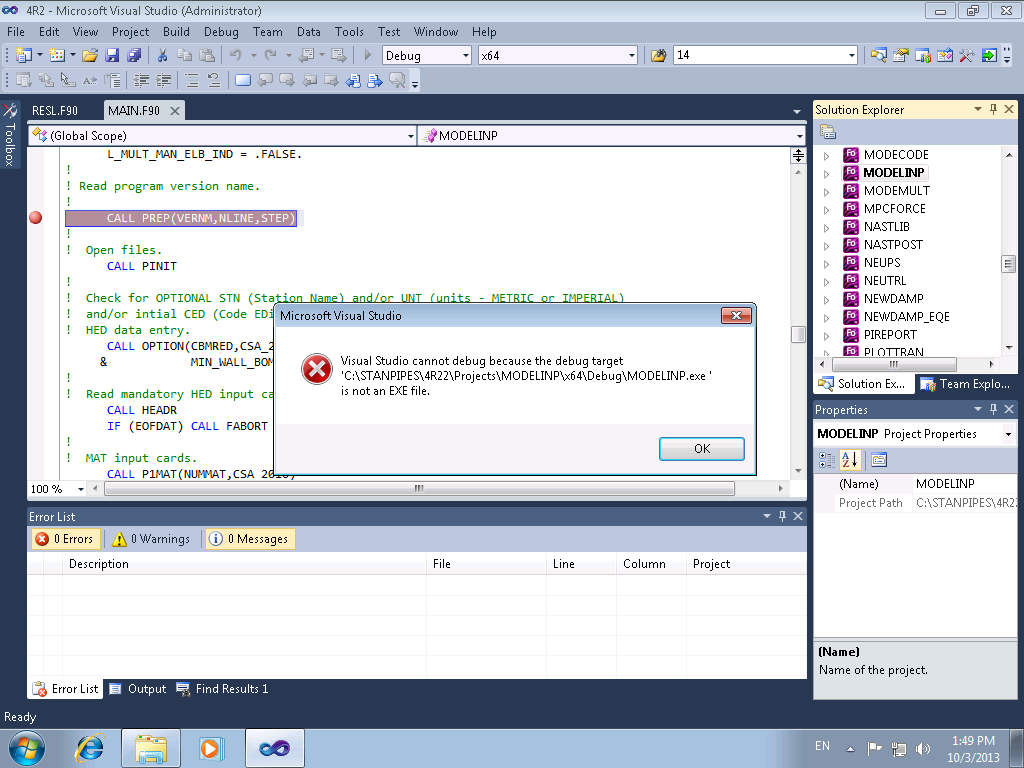
won't go into debug mode due to subject message.
any ideas?
Linda
Link Copied
- Mark as New
- Bookmark
- Subscribe
- Mute
- Subscribe to RSS Feed
- Permalink
- Report Inappropriate Content
- Mark as New
- Bookmark
- Subscribe
- Mute
- Subscribe to RSS Feed
- Permalink
- Report Inappropriate Content
- Mark as New
- Bookmark
- Subscribe
- Mute
- Subscribe to RSS Feed
- Permalink
- Report Inappropriate Content
Was an answer to this found? I have recently reconstructed a large Win32 solution from scratch with an X64 build. I have lots of new bugs to find and got this message when I tried the first such debug. "Visual Studio cannot debug because the target _.exe is not an exe file." Of course, it certainly is an exe file; so something is up which blocks its recognition as such. I am using Visual Studio 2010 on a Windows 7 operating system. I just updated the compiler with Package ID w_fcompxe_2013_sp1.0.103. However, the message persists.
- Mark as New
- Bookmark
- Subscribe
- Mute
- Subscribe to RSS Feed
- Permalink
- Report Inappropriate Content
Attach your .vfproj file here (you can do that now!) and I'll see if I can spot a problem. If you want to check first, look at the property Debugging > Command. It should be "$(TargetPath)". Then look at Linker > General > Output File. It should be "$(OutDir)\$(ProjectName).exe". Lastly look at General > Output directory. It should be "$(PlatformName)\$(ConfigurationName)" (for an x64 configuration, by default).
- Mark as New
- Bookmark
- Subscribe
- Mute
- Subscribe to RSS Feed
- Permalink
- Report Inappropriate Content
I checked the properties you mention, Steve. They all check out. One anomaly of my own construction concerns the location of the project folders for the solution (which contains 94 projects). I make them subfolders of a master folder "Projects" while the source code resides in "Programs". I have made a couple of screen captures which will illustrate the situation as well as attaching the vfproj file as you asked.
I hasten to add that the arrangement of projects, source code etc. under the solution folder is what I have always done - with Visual Sturio 2005 and earlier 2003. So I was not expecting anything new.
Cheers!
Tom Stevens
- Mark as New
- Bookmark
- Subscribe
- Mute
- Subscribe to RSS Feed
- Permalink
- Report Inappropriate Content
Would you please show me a screenshot from right clicking on Computer and selecting Properties?
- Mark as New
- Bookmark
- Subscribe
- Mute
- Subscribe to RSS Feed
- Permalink
- Report Inappropriate Content
Sorry to have to ask Steve. What "Computer" indicator are we talking about? I don't see anything of the sort in Visual Studio 2010. (But then, I have just started using it.)
- Mark as New
- Bookmark
- Subscribe
- Mute
- Subscribe to RSS Feed
- Permalink
- Report Inappropriate Content

- Mark as New
- Bookmark
- Subscribe
- Mute
- Subscribe to RSS Feed
- Permalink
- Report Inappropriate Content
OK Steve,
I believe the attached is what you asked for. It is a Windows 7 box we are using for testing in advance of a move from XP.
- Mark as New
- Bookmark
- Subscribe
- Mute
- Subscribe to RSS Feed
- Permalink
- Report Inappropriate Content
Nothing was attached. You need to click on "Start Upload".
- Mark as New
- Bookmark
- Subscribe
- Mute
- Subscribe to RSS Feed
- Permalink
- Report Inappropriate Content
- Mark as New
- Bookmark
- Subscribe
- Mute
- Subscribe to RSS Feed
- Permalink
- Report Inappropriate Content
Ok, thanks. Not what I thought the problem might be. Can you send me the EXE? Zip it and use Send Author a Message and attach there.
- Mark as New
- Bookmark
- Subscribe
- Mute
- Subscribe to RSS Feed
- Permalink
- Report Inappropriate Content
Steve,
Thanks for your willingness to help with this. My belief is that it is an IDE feature. I never had any trouble with interactive debugging the same solution on an XP Win32 build. The case in point is linked to three dll's which I would need also to send you. I will try to create a much simpler entity which shows the same problem and send you that in due course. We can pick up on the IDE feature then if I can't get it sorted out myself.
For now, let me ask you about the problem that induced the need for the interactive debug. What I could do was to perform a DEBUG build of the solution and use the walkback information to locate the problematic lines. But let me place it in a new thread under a more meaningful title.
Cheers!
Tom
- Mark as New
- Bookmark
- Subscribe
- Mute
- Subscribe to RSS Feed
- Permalink
- Report Inappropriate Content
I don't need the DLLs - I don't want to run the EXE. Just examine it. But please do this - run DependencyWalker and have it analyze your EXE. Ignore complaints about "delay load DLLs". What else does it say?
- Mark as New
- Bookmark
- Subscribe
- Mute
- Subscribe to RSS Feed
- Permalink
- Report Inappropriate Content
- Mark as New
- Bookmark
- Subscribe
- Mute
- Subscribe to RSS Feed
- Permalink
- Report Inappropriate Content
Groundsel, if you try to run this from a command prompt, what is the error? Please enable creation of a link map in the Linker property page, relink the EXE and attach a zip of the .map file.
- Mark as New
- Bookmark
- Subscribe
- Mute
- Subscribe to RSS Feed
- Permalink
- Report Inappropriate Content
You should analyse with Dependency walker or with other PE parsing tool your executable.For example one bit in PE header file (do not remember) which file is used to encode PE file as a exe or DLL.
- Mark as New
- Bookmark
- Subscribe
- Mute
- Subscribe to RSS Feed
- Permalink
- Report Inappropriate Content
The solution in which I had this error was not a default Visual Studio builld. I placed the projects in a "Projects" subfolder and the source code in a separate "Programs" subfolder. The compilation targets for interactive debugging were in a parallel "Test" subfolder.It had caused no trouble with earlier Win32 builds and still does not - with today's compiler. However, the VS 2010 IDE with the X64 build is another matter.
I took the sample executable I sent Steve and rebuilt as much of the solution as necessary to debug it interactively. This time, I began with the projects' source code and let the IDE place the projects; making no attempt to second guess it. That was indeed the ticket. I can interactively debug now with that build.
So I now have two choices. I can either rebuild the entire solution (all 94 projects) in the manner the IDE seems to want. Or, I can keep a separate build populated as necessary when the occasion for interactive debugging comes up. I am inclined to the latter solution since many of the projects will rarely even be used; let alone be needful of interactive debuggin. The IDE has no trouble building executables or dll's with the old structure; only with the debugging.
Thanks to all who gave advice. I am posting this in case others encounter the same issue.
- Subscribe to RSS Feed
- Mark Topic as New
- Mark Topic as Read
- Float this Topic for Current User
- Bookmark
- Subscribe
- Printer Friendly Page