- Mark as New
- Bookmark
- Subscribe
- Mute
- Subscribe to RSS Feed
- Permalink
- Report Inappropriate Content
I do see the requirement of a G45/GM45 chipset and also Vista driver revision >= 15.13.0.1646 in the release notes of GPA.
Given that the Gen5.0 architecture is very related to the Gen4.0 architecture used by the popular G35/GM965 chipsets: Are there any plans to support GPA on the latter ones? Currently Gen4.0 is stuck at Vista driver revision 15.12.4.1666 and is not supported.
Given that the Gen5.0 architecture is very related to the Gen4.0 architecture used by the popular G35/GM965 chipsets: Are there any plans to support GPA on the latter ones? Currently Gen4.0 is stuck at Vista driver revision 15.12.4.1666 and is not supported.
1 Solution
- Mark as New
- Bookmark
- Subscribe
- Mute
- Subscribe to RSS Feed
- Permalink
- Report Inappropriate Content
Hello,
The development team has looked at your capture file, and has provided some explanations back to me to explain what is happening in your situation.
First of all, as Frame Analyzer is showing, the capture file does not contain any shaders (pixel or vertex). It appears that the application has queried the capabilities of the graphics display, and has decided not to use any shaders. Since we don't have the source code for the different applications, we can't examine the logic behind their decision to use a particular set of visual effects. [NOTE: Obviously the intent of GPA is to help applications improve the overall graphics performance, so that in many cases applications can use more complex visual effects and still meet their FPS goal.]
Secondly, here's some details on the speedup you are seeing when using "simple pixel shaders". DirectX9 allows two alternative ways of rendering: fixed pipeline and programmable pipeline (i.e., shaders). If there are no shaders bound to the pipeline, then the graphics card performs some built-in algorithms to calculate pixels colors. If the pixel shader is bound to the pipeline it is its responsibility to calculate pixel color. If we set a "simple pixel shader" to the Draw Call that used a fixed pipeline in the original application, then we substitute the built-in shading algorithm by our own which is very simple: set a constant color to each input pixel. This way Frame Analyzer does not reduce the number of pipeline stages, it just simplifies the Texturing and Lighting stages.
Hopefully this answers your questions.
Regards,
Neal
PS-> You may have seen that I've modified the text of this response based upon additional feedback from the person who implemented this code in GPA.
Link Copied
19 Replies
- Mark as New
- Bookmark
- Subscribe
- Mute
- Subscribe to RSS Feed
- Permalink
- Report Inappropriate Content
I'll try responding to this question the best I can... let me know if this answers your questions.
The short story is that GPA does not restrict you from attempting to run GPA on other than fully supported configurations. To run GPA on Gen4 chipsets and other non-Intel graphics, answer "yes" when you see the message "Warning: Unsupported GPU in target system. Please consult the documentation for supported system configurations. GPU will attempt to run, but may encounter errors. Do you wish to continue?"
However, when attempting to run GPA on other than fully supported systems, realize that (a) System Analyzer will not display all metrics (such as gpu utilization), and (b) if you run into errors or other issues running GPA we will not be able to provide support for these configurations (such as workarounds or fixes).
The long answer is that GPA needs graphics hardware support and graphics driver "hooks" in order to provide the full set of metrics back to the user. With hundreds (thousands?) of systems out there, we haven't been able to test GPA on all possible combinations of systems, and therefore cannot provide guidance on what you can expect to see on configuration vs. configuration . However, this being said, realize that many users have been able to utilize GPA (both System Analyzer and Frame Analyzer) for performance optimization on a number of unsupported configurations.
So with respect to Gen4 chipsets, these systems do not have the built-in hardware support or the driver support required by GPA, and there are no plans at this time to modify these systems to make them fully supportable by GPA.
If you do run GPA on Gen4, please let us know whether this configuration provides reasonable results back to you.
Regards,
Neal
The short story is that GPA does not restrict you from attempting to run GPA on other than fully supported configurations. To run GPA on Gen4 chipsets and other non-Intel graphics, answer "yes" when you see the message "Warning: Unsupported GPU in target system. Please consult the documentation for supported system configurations. GPU will attempt to run, but may encounter errors. Do you wish to continue?"
However, when attempting to run GPA on other than fully supported systems, realize that (a) System Analyzer will not display all metrics (such as gpu utilization), and (b) if you run into errors or other issues running GPA we will not be able to provide support for these configurations (such as workarounds or fixes).
The long answer is that GPA needs graphics hardware support and graphics driver "hooks" in order to provide the full set of metrics back to the user. With hundreds (thousands?) of systems out there, we haven't been able to test GPA on all possible combinations of systems, and therefore cannot provide guidance on what you can expect to see on configuration
So with respect to Gen4 chipsets, these systems do not have the built-in hardware support or the driver support required by GPA, and there are no plans at this time to modify these systems to make them fully supportable by GPA.
If you do run GPA on Gen4, please let us know whether this configuration provides reasonable results back to you.
Regards,
Neal
- Mark as New
- Bookmark
- Subscribe
- Mute
- Subscribe to RSS Feed
- Permalink
- Report Inappropriate Content
Yes I'm aware that you can launch and still try it.
Using X3100 on GM965 and Vista 32-Bit v15.12.4.1666 drivers I get:
. FrameCapture + FrameAnalyzer seem to work okay. However I don't see any shader code to play with and still Experiments / Simple Pixel Shader makes a performance difference.
. SystemAnalyzer doesn't display GPU metrics (only DX and CPU). Overrides work however.
Some of the missing functionality might be due to the lack of a sufficiently instrumented driver. That's why I was mentioning the driver revisions. Will have to wait whether some v15.13.x or later driver will pop up for the GM965.
Using X3100 on GM965 and Vista 32-Bit v15.12.4.1666 drivers I get:
. FrameCapture + FrameAnalyzer seem to work okay. However I don't see any shader code to play with and still Experiments /
. SystemAnalyzer doesn't display GPU metrics (only DX and CPU). Overrides work however.
Some of the missing functionality might be due to the lack of a sufficiently instrumented driver. That's why I was mentioning the driver revisions. Will have to wait whether some v15.13.x or later driver will pop up for the GM965.
- Mark as New
- Bookmark
- Subscribe
- Mute
- Subscribe to RSS Feed
- Permalink
- Report Inappropriate Content
Hello,
Since this graphics device does not support gpu counters in the hardware, you won't see gpu metrics displayed in System Analyzer. Note that an updated graphics driver won't be able to add this capability in the future, since it's a hardware issue and not a driver issue.
As to not being able to see the shader code, I'm doing some more checking on this.
Regards,
Neal
- Mark as New
- Bookmark
- Subscribe
- Mute
- Subscribe to RSS Feed
- Permalink
- Report Inappropriate Content
I did some more checking with the development team on your questions regarding shader code within Frame Analyzer.
While you might not be able to see the shader code in HLSL format, you should be able to see something if you use the "Assembly" tab instead. The "Assembly" tab should work independent of the gfx device you are using.
One other possible explanation is you won't see any shader code if you haven't selected any work items in either the Work Item Visualization Panel (top window) or the Scene Overview Panel (left-hand window). However, you mentioned that selecting "simple pixel shader" appears to work for you, so this would imply that you've already selected one or more work items.
Therefore, please let me know whether the "Assembly" tab works for you, and if not can you provide more info about your application that might help us understand a little more about what you are doing?
thanks!
Neal
- Mark as New
- Bookmark
- Subscribe
- Mute
- Subscribe to RSS Feed
- Permalink
- Report Inappropriate Content
I've been using GPA on Google Earth (DirectX 9) 5.0.11337.1968 and TrackMania Nations Forever 2.11.11 (free game DirectX 9).
The following applies to TrackMania:
If I select the entire scene that means all Draw[Indexed]Primitive calls except the UpdateTexture(), Clear() calls then all Vertex and Pixel Shaders with ID 2-515 are zero. As a consequence I can't see or select Shader code. Still using Experiments / Simple Pixel Shader reduces the overall render time by 25%. That means there must be some Shader code - I just can't see it.
The situation with Google Earth is basically the same - except that the gain of Simple Pixel Shader is just 7-10%.
The following applies to TrackMania:
If I select the entire scene that means all Draw[Indexed]Primitive calls except the UpdateTexture(), Clear() calls then all Vertex and Pixel Shaders with ID 2-515 are zero. As a consequence I can't see or select Shader code. Still using Experiments /
The situation with Google Earth is basically the same - except that the gain of
- Mark as New
- Bookmark
- Subscribe
- Mute
- Subscribe to RSS Feed
- Permalink
- Report Inappropriate Content
thanks for the info... i'll run these myself and see if i can duplicate the issue.
regards,
Neal
regards,
Neal
- Mark as New
- Bookmark
- Subscribe
- Mute
- Subscribe to RSS Feed
- Permalink
- Report Inappropriate Content
Hello,
I just downloaded Google Earth, and with System Analyzer I ran the application in DX9 mode on a non-supported graphics device (an HP workstation with non-Intel graphics). As expected, in System Analyzer I see only cpu and DX metrics.
I then captured a frame, and loaded this into Frame Analyzer. I then selected the entire frame, then selected the shaders tab, then selected Assembly, then from the ID1 row I selected the vertex item (989), and I'm able to see the shader code.
This is what I expected to see for non-supported devices. Does this help?
Regards,
Neal
- Mark as New
- Bookmark
- Subscribe
- Mute
- Subscribe to RSS Feed
- Permalink
- Report Inappropriate Content


- Mark as New
- Bookmark
- Subscribe
- Mute
- Subscribe to RSS Feed
- Permalink
- Report Inappropriate Content
Thanks... this was helpful!
As expected, entries with a 0 for the vertex or pixel shader do not have a shader associated with them, and therefore you won't see anything displayed. You've stated that every single entry is 0, which is surprising, but I guess this is possible.
In the sample I created with Google Earth, though many ergs had no shaders (that is, the vertex and pixel index was zero), a number were non-zero, and for these I was able to see the shader code. Would you be able to run Google Earth instead and verify that all shader entries for Google Earth are zero as well?
Also, you didn't show the "sample variance" column -- is the percentage high or low? In general, you want this number to be in the few percent range for more consistent and accurate results. If this number is high, it's not clear whether your results are accurate enough to get meaningful data that you can use for analysis.
I look forward to your reply...
Regards,
Neal
- Mark as New
- Bookmark
- Subscribe
- Mute
- Subscribe to RSS Feed
- Permalink
- Report Inappropriate Content
Hello,
I just realized that my last post may not have been clear in its intent... Basically, I would like some more information as to whether the issues you are seeing are related to the application you're analyzing, your configuration, the GPA application, "or something else...".
That's why I'm asking you to verify whether you see any pixel shaders or vertex shaders with Google Earth, as I've been able to see the pixel and vertex shaders in this "game".
Also, though it's probably not an issue for this specific case, realize that using the "simple pixel shader" will render all pixels with the simple pixel shader, overriding both the pixel/vertex shaders and texture map operations. Therefore, some of the improvement you are observing may be due to bypassing texture map operations as well.
Regards,
Neal
ps-> Also, if you are looking for good sample applications to play with, I would recommend downloading the full DX SDK from Microsoft, and looking at some of these for testing GPA.
- Mark as New
- Bookmark
- Subscribe
- Mute
- Subscribe to RSS Feed
- Permalink
- Report Inappropriate Content
If I use FrameAnalyzer on a frame captured from google earth, I don't see a single shaders. At the moment I have #0 - #524 and they are all zero. In the other application I caputed I also never saw a single non zero shader.
"sample variance" is quite high with up to 10-20%. Most likely because I'm currently using the same Notebook for frame analyzing and frame rendering. However if I toggle Simpel Pixel Shader back and forth I do see a stable improvement of 10% in Rendertime. Even if variance is up to 20% I think that's meaningful. The other application I used did result in a greater improvement. It's just easier for you to get hands on Google Earth, that's why I used it.
I don't know how to display the texture map operations. But if I change the Rasterization FILLMODE=D3DFILL_WIREFRAME I still see improvements by toggeling Simple Pixel Shader. In that case I assume texture map operations are not active in D3D_FILL_WIREFRAME.
DX SDK is not yet installed. But I can hardly image it does make a difference regarding displaying of the shader assembly code. However DX SDK will probably help to display HLSL code I guess.
"sample variance" is quite high with up to 10-20%. Most likely because I'm currently using the same Notebook for frame analyzing and frame rendering. However if I toggle
I don't know how to display the texture map operations. But if I change the Rasterization FILLMODE=D3DFILL_WIREFRAME I still see improvements by toggeling
DX SDK is not yet installed. But I can hardly image it does make a difference regarding displaying of the shader assembly code. However DX SDK will probably help to display HLSL code I guess.
- Mark as New
- Bookmark
- Subscribe
- Mute
- Subscribe to RSS Feed
- Permalink
- Report Inappropriate Content
Hello again,
I'm surprised that you're not seeing shaders for either application. I'll work with the development team and see if we can think of anything else that might be causing this to occur.
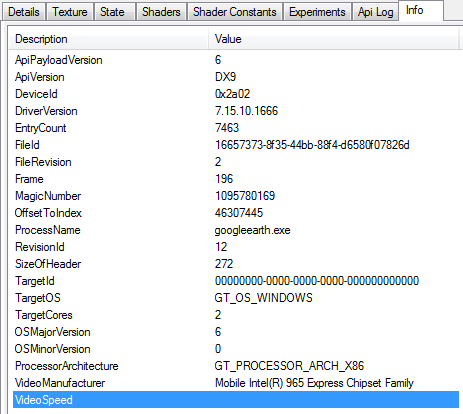
In the meantime, would you be able to upload your frame capture file here? Also, please use the "get info" tab in Frame Analyzer to copy the info here for us to see the full info on your configuration.
Thanks!
Regards,
Neal
ps-> I agree that the DX SDK shouldn't affect the shader code; I was mentioning this in case you wanted to take a look at an application where you also had the source code available.
I'm surprised that you're not seeing shaders for either application. I'll work with the development team and see if we can think of anything else that might be causing this to occur.
In the meantime, would you be able to upload your frame capture file here? Also, please use the "get info" tab in Frame Analyzer to copy the info here for us to see the full info on your configuration.
Thanks!
Regards,
Neal
ps-> I agree that the DX SDK shouldn't affect the shader code; I was mentioning this in case you wanted to take a look at an application where you also had the source code available.
- Mark as New
- Bookmark
- Subscribe
- Mute
- Subscribe to RSS Feed
- Permalink
- Report Inappropriate Content
- Mark as New
- Bookmark
- Subscribe
- Mute
- Subscribe to RSS Feed
- Permalink
- Report Inappropriate Content
Hello,
The development team has looked at your capture file, and has provided some explanations back to me to explain what is happening in your situation.
First of all, as Frame Analyzer is showing, the capture file does not contain any shaders (pixel or vertex). It appears that the application has queried the capabilities of the graphics display, and has decided not to use any shaders. Since we don't have the source code for the different applications, we can't examine the logic behind their decision to use a particular set of visual effects. [NOTE: Obviously the intent of GPA is to help applications improve the overall graphics performance, so that in many cases applications can use more complex visual effects and still meet their FPS goal.]
Secondly, here's some details on the speedup you are seeing when using "simple pixel shaders". DirectX9 allows two alternative ways of rendering: fixed pipeline and programmable pipeline (i.e., shaders). If there are no shaders bound to the pipeline, then the graphics card performs some built-in algorithms to calculate pixels colors. If the pixel shader is bound to the pipeline it is its responsibility to calculate pixel color. If we set a "simple pixel shader" to the Draw Call that used a fixed pipeline in the original application, then we substitute the built-in shading algorithm by our own which is very simple: set a constant color to each input pixel. This way Frame Analyzer does not reduce the number of pipeline stages, it just simplifies the Texturing and Lighting stages.
Hopefully this answers your questions.
Regards,
Neal
PS-> You may have seen that I've modified the text of this response based upon additional feedback from the person who implemented this code in GPA.
- Mark as New
- Bookmark
- Subscribe
- Mute
- Subscribe to RSS Feed
- Permalink
- Report Inappropriate Content
Hello,
As a follow-up to the previous post, the GPA team intends to discuss whether the implementation of "simple pixel shaders" should stay as is, or should be modified in a future release to not apply the "simple pixel shader" to the Draw Calls that do not use pixel shaders in the original application.
Your thoughts on this would be appreciated.
Regards,
Neal
- Mark as New
- Bookmark
- Subscribe
- Mute
- Subscribe to RSS Feed
- Permalink
- Report Inappropriate Content
With the modifications you made to your previous posting I do understand now why Simple Pixel Shader results in a quite different performance even if no pixel shaders are used. Currently I don't have the requirement of a different behaving pixel shader replacement. Instead I'd appreciate if the change in the behavior of the entire DirectX and driver stack that results from Simple Pixel Shader would be documented in "Intel Graphics Performance Analyzer Help.chm". This will allow to draw the right conclusions from those experiments.
Meanwhile I read your FAQ, Knowledge Base, most of the documentation of GPA and did play with GPA quite a bit. My results are to some degree surprising. I notice that the intel (X3100) graphics is extremely sensitive to memory bandwith.
Going from Single Channel -> Dual Channel DDR2-667 memory results in a surprising fps boost of up to 46.6% in available games:

If I compare these results with shared memory graphics of other vendors (AMD 780G/790GX/nVidia GeForce 8200/8300), I notice the general performance is higher - up to 7x compared to intel G45. Somehow those devices are able to use the available bandwith more efficient (all used DualChannel DDR2-800 in this case).
If I had a wish: How do I find inefficient memory i/o with the aid of GPA? Since the other vendors don't suffer from this problem this much, I think I need to know more about the hardware. I'm aware of the document Getting the Most Out of Intel Graphics and it's helpful for avoiding bandwidth wastings upfront. But how can I use GPA to find these memory bottlenecks afterwords. Maybe some caches, prefetches, write buffers, memory tilings simply don't work the way they are supposed to work with a particular application and maybe GPA can help to identify those issues.
I know that's unrelated to my initial posting. It's not urgent. Thanx.
Meanwhile I read your FAQ, Knowledge Base, most of the documentation of GPA and did play with GPA quite a bit. My results are to some degree surprising. I notice that the intel (X3100) graphics is extremely sensitive to memory bandwith.
Going from Single Channel -> Dual Channel DDR2-667 memory results in a surprising fps boost of up to 46.6% in available games:
If I compare these results with shared memory graphics of other vendors (AMD 780G/790GX/nVidia GeForce 8200/8300), I notice the general performance is higher - up to 7x compared to intel G45. Somehow those devices are able to use the available bandwith more efficient (all used DualChannel DDR2-800 in this case).
If I had a wish: How do I find inefficient memory i/o with the aid of GPA? Since the other vendors don't suffer from this problem this much, I think I need to know more about the hardware. I'm aware of the document Getting the Most Out of Intel Graphics and it's helpful for avoiding bandwidth wastings upfront. But how can I use GPA to find these memory bottlenecks afterwords. Maybe some caches, prefetches, write buffers, memory tilings simply don't work the way they are supposed to work with a particular application and maybe GPA can help to identify those issues.
I know that's unrelated to my initial posting. It's not urgent. Thanx.
- Mark as New
- Bookmark
- Subscribe
- Mute
- Subscribe to RSS Feed
- Permalink
- Report Inappropriate Content
Thanks for your post...
I've split your initial questions into three different items:
Regards,
Neal
I've split your initial questions into three different items:
- "I'd appreciate if the change in the behavior of the entire DirectX and driver stack that results from
Simple Pixel Shader would be documented..."
--> Short term, what we'll be doing is updating the documentation to include information about what is actually going on, and discuss why you might observe performance differences that you don't expect. We'll also include a detailed comment in the "readme" file in a future version of GPA that discusses this, especially with respect to graphics devices that are not officially supported. Longer term, we are looking at different options available for resolving this issue, including effectively disabling this experiment when no shaders are available. - "If I compare these results with shared memory graphics of other vendors (AMD 780G/790GX/nVidia GeForce 8200/8300), I notice the general performance is higher - up to 7x compared to Intel G45. Somehow those devices are able to use the available bandwidth more efficient (all used DualChannel DDR2-800 in this case)."
--> For questions regarding the hardware characteristics of specific graphics devices, I would recommend that you post this comment in the following forum: Developing Software for Visual Computing, as this forum has the right audience of people that would be able to provide a response to your questions in this area. - "How do I find inefficient memory i/o with the aid of GPA? ... I'm aware of the document Getting the Most Out of Intel Graphics and it's helpful for avoiding bandwidth wastings upfront. But how can I use GPA to find these memory bottlenecks afterwords. Maybe some caches, prefetches, write buffers, memory tilings simply don't work the way they are supposed to work with a particular application and maybe GPA can help to identify those issues."
--> Currently the Intel graphics chipsets do not have hardware support for gpu memory bandwidth, and therefore GPA cannot gather these metrics (all you can find out is overall system memory bandwidth, which doesn't get you what you want). The GPA team understands the importance of this feature (and the others you mentioned such as cache misses) for allowing developers to better understand and optimize their games, and is considering adding one or more of these in a future release.
Regards,
Neal
- Mark as New
- Bookmark
- Subscribe
- Mute
- Subscribe to RSS Feed
- Permalink
- Report Inappropriate Content
Yes it does help. How does the same work on laptops with inbuilt drivers - either intel/non-intel. Any page pointing to the test you did?
Kate
- Mark as New
- Bookmark
- Subscribe
- Mute
- Subscribe to RSS Feed
- Permalink
- Report Inappropriate Content
Hello,
I'm not sure exactly what question you're asking here. Can you clarify? In particular, if you have a specific system in mind, please provide more information on the graphics chipset that you have, and I'll try to help out.
Regards,
Neal
I'm not sure exactly what question you're asking here. Can you clarify? In particular, if you have a specific system in mind, please provide more information on the graphics chipset that you have, and I'll try to help out.
Regards,
Neal
Reply
Topic Options
- Subscribe to RSS Feed
- Mark Topic as New
- Mark Topic as Read
- Float this Topic for Current User
- Bookmark
- Subscribe
- Printer Friendly Page