- Mark as New
- Bookmark
- Subscribe
- Mute
- Subscribe to RSS Feed
- Permalink
- Report Inappropriate Content
Hi, I am using Vtune profiler v2020 update 1 with Intel FPGA OpenCL SDK v20.1, and I am trying to read the profiled data with vtune. However, I could not get the CPU/FPGA interaction tab as described in the documents.
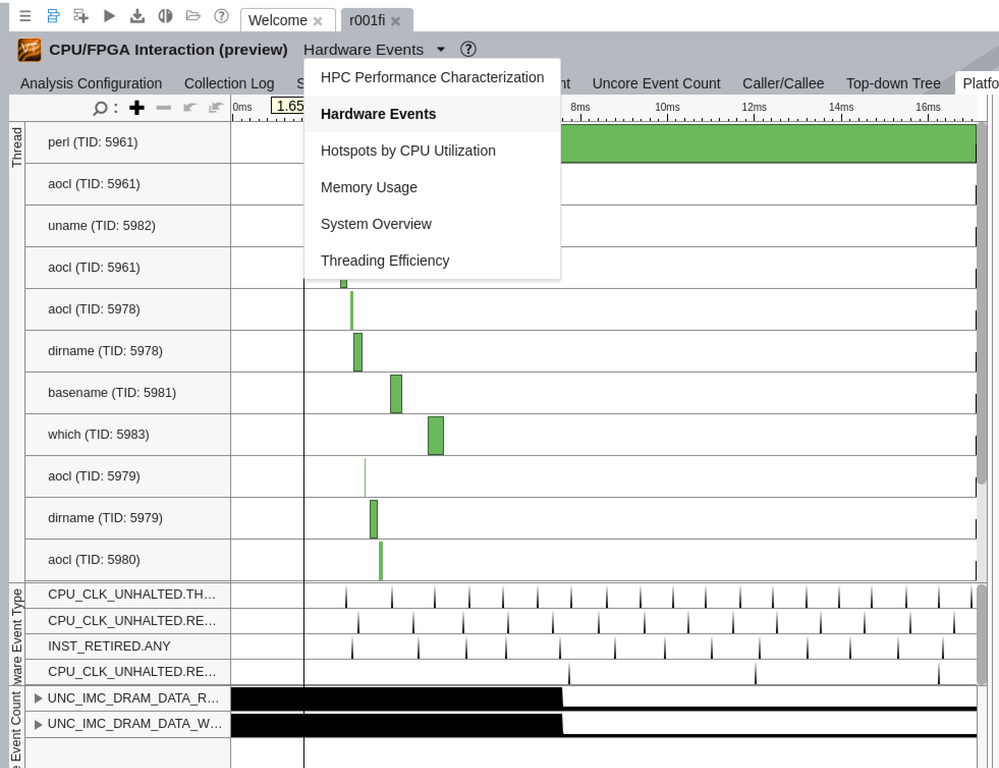
This is what I got:
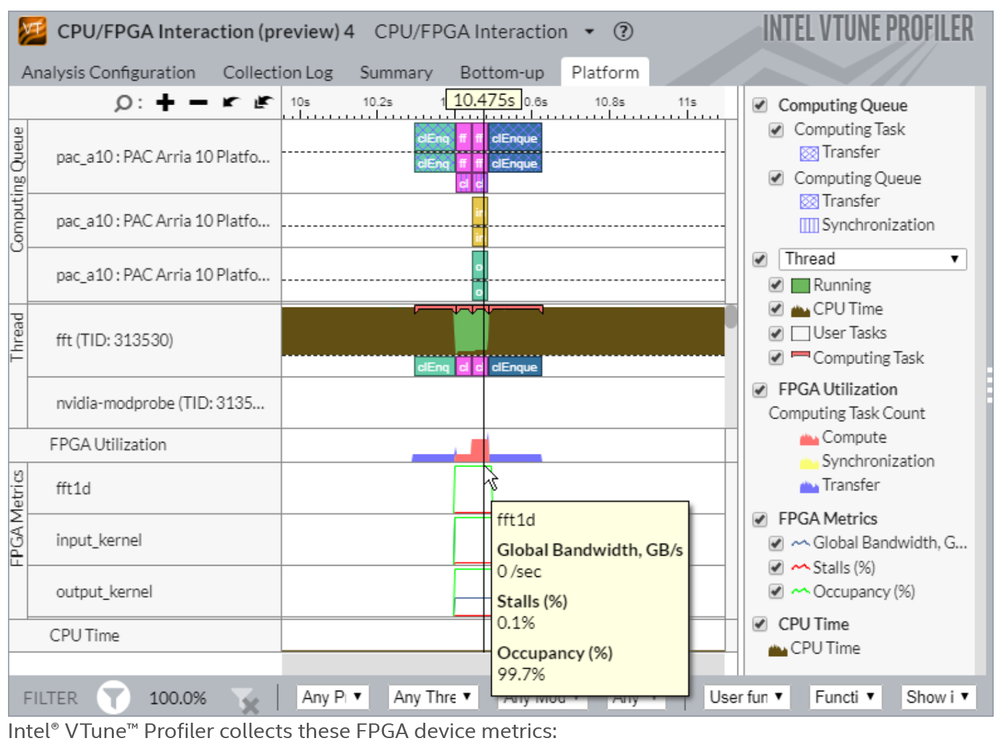
This is what is shown in the online document https://software.intel.com/content/www/us/en/develop/documentation/vtune-help/top/analyze-performance/platform-analysis-group/cpu-fpga-interaction-analysis-preview.html
As compared above, there is no CPU/FPGA interaction tab in my tool. How could I get it displayed ?
The vtune is running in driverless mode with the following env set:
sudo sh -c "echo 0 > /proc/sys/kernel/perf_event_paranoid"
sudo sh -c "echo 0 > /proc/sys/kernel/yama/ptrace_scope"
The Intel FPGA OpenCL SDK is v20.1 and OS is Ubuntu 16.04.
Link Copied
- Mark as New
- Bookmark
- Subscribe
- Mute
- Subscribe to RSS Feed
- Permalink
- Report Inappropriate Content
Helo,
Can you confirm you had follow thoroughly the instruction at the bottom of the page in the "Configure and Run Analysis" section? You may have missed out some of the steps;
1. Please check if you had set up the project correctly:
2. Select "CPU/FPGA Interaction" analysis type from the Platform Analysis group in the HOW Pane, in step no 3.
- Tags:
- i
- Mark as New
- Bookmark
- Subscribe
- Mute
- Subscribe to RSS Feed
- Permalink
- Report Inappropriate Content
Hi, the problem has been solved with the help of an AE.
One need to run the "aocl profile ./youhost -x yourKernel.aocx" command to manually generate the profile.json file before using the Vtune gui. Otherwise, vtune will not work correctly.
This information was not described in the user manual.
- Tags:
- ble
- Subscribe to RSS Feed
- Mark Topic as New
- Mark Topic as Read
- Float this Topic for Current User
- Bookmark
- Subscribe
- Printer Friendly Page

