- Mark as New
- Bookmark
- Subscribe
- Mute
- Subscribe to RSS Feed
- Permalink
- Report Inappropriate Content
Hello, I have to quickly memory copy 512 bytes using a 4th generation i7 core in Visual C++ (using Intel compiler), and want to avoid the call to memcpy as everything is aligned to 64 bytes.
For that, I am using 16 _mm256_load_si256 intrinsincs operations (on ymm0-15) followed by 16 _mm256_stream_si256 operations (same ymm registers). Alternatively, using 16 _mm256_store_si256 operations in place of the latter ones.
Using VTune, I noted a non-negligible difference of performance whether the above 32 instructions are interleaved or not. I tried several patterns of interleaving, getting different performances (in any case, faster than memcpy).
Question: What is the best pattern for interleaving loads/stores at this point?
Thanks
-Roberto
- Tags:
- Intel® Advanced Vector Extensions (Intel® AVX)
- Intel® Streaming SIMD Extensions
- Parallel Computing
Link Copied
- « Previous
-
- 1
- 2
- Next »
- Mark as New
- Bookmark
- Subscribe
- Mute
- Subscribe to RSS Feed
- Permalink
- Report Inappropriate Content
@Vladimir
>>>You may also consider increasing priority of the callback's process/thread with something like:
SetPriorityClass(GetCurrentProcess(), REALTIME_PRIORITY_CLASS);
to avoid long delays caused by the switching.>>>
Is thread priority increment to Real Time really helpful in minimizing context switching frequency of the thread which priority is increased?
I ask this mainly because I have problem with weird results of the function timing. I suspect that context switching can be responsible for that.
- Mark as New
- Bookmark
- Subscribe
- Mute
- Subscribe to RSS Feed
- Permalink
- Report Inappropriate Content
@roberto
I am not sure how much will it be applicable to your scenario, but anyway I will ask that. Does your Ethernet NIC driver has interrupt coalescing feature? It seems that you have a lot of interrupts intermixed with the callbacks (as you pointed it out). Does your driver signals interrupt on every frame?
- Mark as New
- Bookmark
- Subscribe
- Mute
- Subscribe to RSS Feed
- Permalink
- Report Inappropriate Content
iliyapolak wrote:
>>>You may also consider increasing priority of the callback's process/thread with something like:
SetPriorityClass(GetCurrentProcess(), REALTIME_PRIORITY_CLASS);
to avoid long delays caused by the switching.>>>Is thread priority increment to Real Time really helpful in minimizing context switching frequency of the thread which priority is increased?
I ask this mainly because I have problem with weird results of the function timing. I suspect that context switching can be responsible for that.
I meant the time spent on ring0->ring3 switching. If a callback has higher priority, it is ahead of other requests in a queue.
Threads with high priority are interrupted less frequently because the OS first uses CPUs that run threads with lower priority in case of interrupt.
Timing is really a tough problem, I'm trying to cope with it each and every day. Unfortunately, i don't know a good solution.
Maybe the best way is to run a function dozens of times, then make a break (for a few ms), run it again, and choose the best one :)
- Mark as New
- Bookmark
- Subscribe
- Mute
- Subscribe to RSS Feed
- Permalink
- Report Inappropriate Content
Roberto,
I wrote "increasing priority of the callback's process/thread", not about the driver.
It allows to read the hard drive faster and spend less time on callback call (in case of contention).
I hope your callback 2K buffer is in the global memory, not on the stack?
- Mark as New
- Bookmark
- Subscribe
- Mute
- Subscribe to RSS Feed
- Permalink
- Report Inappropriate Content
@iliyapolak: I think the NIC has coalescing features. Unfortunately, I do not have access to the driver source code so it is my guess. The driver sends streams using RTSP/RTP, where the payload is limited to maximum 1440 bytes (if I remember well), so there are many interrupts with requests for filling the buffer. I checked that the actual RTSP payload for a frame is equal to the buffer size: it is a dual-buffer filling scheme that is applied for each sent frame. There is a rationale behind this: the buffer is relatively small both for the payload limit and also for low latency.
@Vladimir: By printing the address of the buffer, it seems to me that it is page-aligned malloc’d. Sorry for my misunderstanding, now I know what you meant: I tried time ago to increase the priority of the entire process: this increases the performance of the underlying system calls but not significantly that of the callback as it is called by the driver. But I can try it again with your suggested instruction inside the callback. Thanks.
As a side note, I am posting my question on this forum as I reasoned so far only in terms of cache efficiency and CPU time, without concerning much the many interrupts occuring meanwhile. I think that I should change point of view. From my empirical observations, an easily interruptable copy, e.g. alternating loads and stores, seems to go better than performing all loads before and the all stores. The latter is the conceptually the best if no interrupts occurs, but I suspect that otherwise an interrupt can freeze it, performing worse than alternating... This is a counterintuitive for me, and context switching is the best approximated answer that I have guessed so far. It is difficult to reproduce the situation as I do not know how to get the same patterns of interrupts. So guessing, reasoning and experimenting is my plan so far :)
- Mark as New
- Bookmark
- Subscribe
- Mute
- Subscribe to RSS Feed
- Permalink
- Report Inappropriate Content
Roberto!!
Call SetPriorityClass() not inside the callback, but at the app start.
I think the priority of callback is same. Check it with GetPriorityClass(GetCurrentProcess()) inside callback.
Your callback is "never" interrupted because the time between h/w interrupts is say 1e-3 sec while callback takes 1e-6 sec.
I suspect the out buffer is provided by the driver, it's static, its location is const, and it's in the fast L1 cache.
So, the problem could be with "in" buffer.
Can you verify this by avoiding reading the in buff and just storing zeros to the "out" one.
I think the callback will be much faster (much more than 2 times) in that case.
- Mark as New
- Bookmark
- Subscribe
- Mute
- Subscribe to RSS Feed
- Permalink
- Report Inappropriate Content
you'd better show a snapshot of process explorer illustrating cpu loading of the problem. it helps to narrow down the scope of problem.
- Mark as New
- Bookmark
- Subscribe
- Mute
- Subscribe to RSS Feed
- Permalink
- Report Inappropriate Content
To make short a long story, it seems to be a scheduling issue regarding the loads/stores, not a buffer issue.
- Let IN be the input buffer and A be the segment of IN that I want to copy, where |A| ≤ 2Kb
- Let OUT be output buffer, divided into four segments B1, B2, B3, B4 s.t. |A|= |B1|=|B2|=|B3|=|B4|
- Goal: I want to perform B1 := A, B2 := A, B3 := A, B4 := A
I made some experiments as suggested by Vladimir. @Jeremy: I measured performance using VTune.
- I tried B1 := A, B2 := B1, B3 := B1, B4 := B1 and there is not a significant change.
- I tried to use only the OUT buffer without reading/writing the IN buffer (as suggested) by loading one register ymm0 with some dummy value and filling B1 using the same ymm0, plus B2 := B1, B3 := B1, B4 := B1. There is not a significant change.
- I repeated the previous experiment using IN buffer instead the OUT buffer (i.e. only performing those ops on IN and not reading/writing OUT). Again, there is not a significant change.
- I filled B with ymm0 and timing halved as expected, since I was performing half of the memory accesess (only stores, no loads).
- Finally, I tried B1 := A, B2 := B1, B3 := B1, B4 := B1 and increaed the process/thread priority to real time and timing improved by roughly 25%.
From what I wrote above, I think it is a scheduling issue, not a buffer/memory issues. For some reason, the run of loads/stored is “disturbed” by the CPU scheduling in the scenario that I am considering in this 3D.
Vladimir Sedach wrote:
Roberto!!
Call SetPriorityClass() not inside the callback, but at the app start.
I think the priority of callback is same. Check it with GetPriorityClass(GetCurrentProcess()) inside callback.Your callback is "never" interrupted because the time between h/w interrupts is say 1e-3 sec while callback takes 1e-6 sec.
I suspect the out buffer is provided by the driver, it's static, its location is const, and it's in the fast L1 cache.
So, the problem could be with "in" buffer.
Can you verify this by avoiding reading the in buff and just storing zeros to the "out" one.
I think the callback will be much faster (much more than 2 times) in that case.
- Mark as New
- Bookmark
- Subscribe
- Mute
- Subscribe to RSS Feed
- Permalink
- Report Inappropriate Content
Roberto,
What about comparing all this with the simplest
ymm = A;
B1 = B2 = B3 = B4 = ymm;
From what you said I can suppose all the buffs are not in the L1 cache.
Perhaps you can check this doing exactly same thing as in callback, but in an ordinary function allocating B in the global scope.
Call it on timer or just in a loop.
Would it change timing considerably or not?
- Mark as New
- Bookmark
- Subscribe
- Mute
- Subscribe to RSS Feed
- Permalink
- Report Inappropriate Content
Roberto,
Snapshots of process explorer help in showing your existing problem, because you still haven't optimized your software with appropriate priority levels / scheduling. Can you clearly describe relevant CPU time between the interrupt of the network card and invocation of your callback? Does your callback run at APC already? Are you sure that your PC is not suffered from interrupt storm? Would it be a problem of RTSP/RTP from another side of the network? Is your calculation small enough that could be placed within DPC (if you dare..)?
Your design of storing 4 x 512 bytes within 2048 bytes may not be optimal, especially you still haven't clearly described how will the 4 (512-byte) buffers be used in further calculations. Will the 4 buffers be accessed by 4 threads? Will the 4 buffers be accessed by 1 thread only? Will the 4 buffers be modified in subsequent calculations? Are you sure that L1 cache of 2048-byte buffer is not evicted at the time of calculation?
If we stick to your first problem only, Vladimir's "B1 = B2 = B3 = B4 = ymm" looks good already. You'd better consider/disclose other factors before further optimization, because local optimization may not be globally optimized...
- Mark as New
- Bookmark
- Subscribe
- Mute
- Subscribe to RSS Feed
- Permalink
- Report Inappropriate Content
>>>Can you clearly describe relevant CPU time between the interrupt of the network card and invocation of your callback? Does your callback run at APC already? Are you sure that your PC is not suffered from interrupt storm?>>>
I quite agree with you. It would be helpful if OP will be willing to upload screenshots of ISR/DPC activity.
- Mark as New
- Bookmark
- Subscribe
- Mute
- Subscribe to RSS Feed
- Permalink
- Report Inappropriate Content
@Roberto
Maybe the small buffer is the reason for high amount of the Interrupts. Anyway you should measure the execution time of DPC routines of NIC ISRs. Regarding coalescing feature what is the approx. data rate in MB/s of RTSP streams? Adding to this how fast is the single fully loaded buffer processed?
- Mark as New
- Bookmark
- Subscribe
- Mute
- Subscribe to RSS Feed
- Permalink
- Report Inappropriate Content
@Vladimir @Jeremy: it is not a win-win situation B1 = B2 = B3 = B4 = ymm as the more ymm registers are used the more they must be saved and restored at each call as required by Windows ABI (only six ymm registers are “free”). I tried this and other variants. They are not winning because of CPU scheduling.
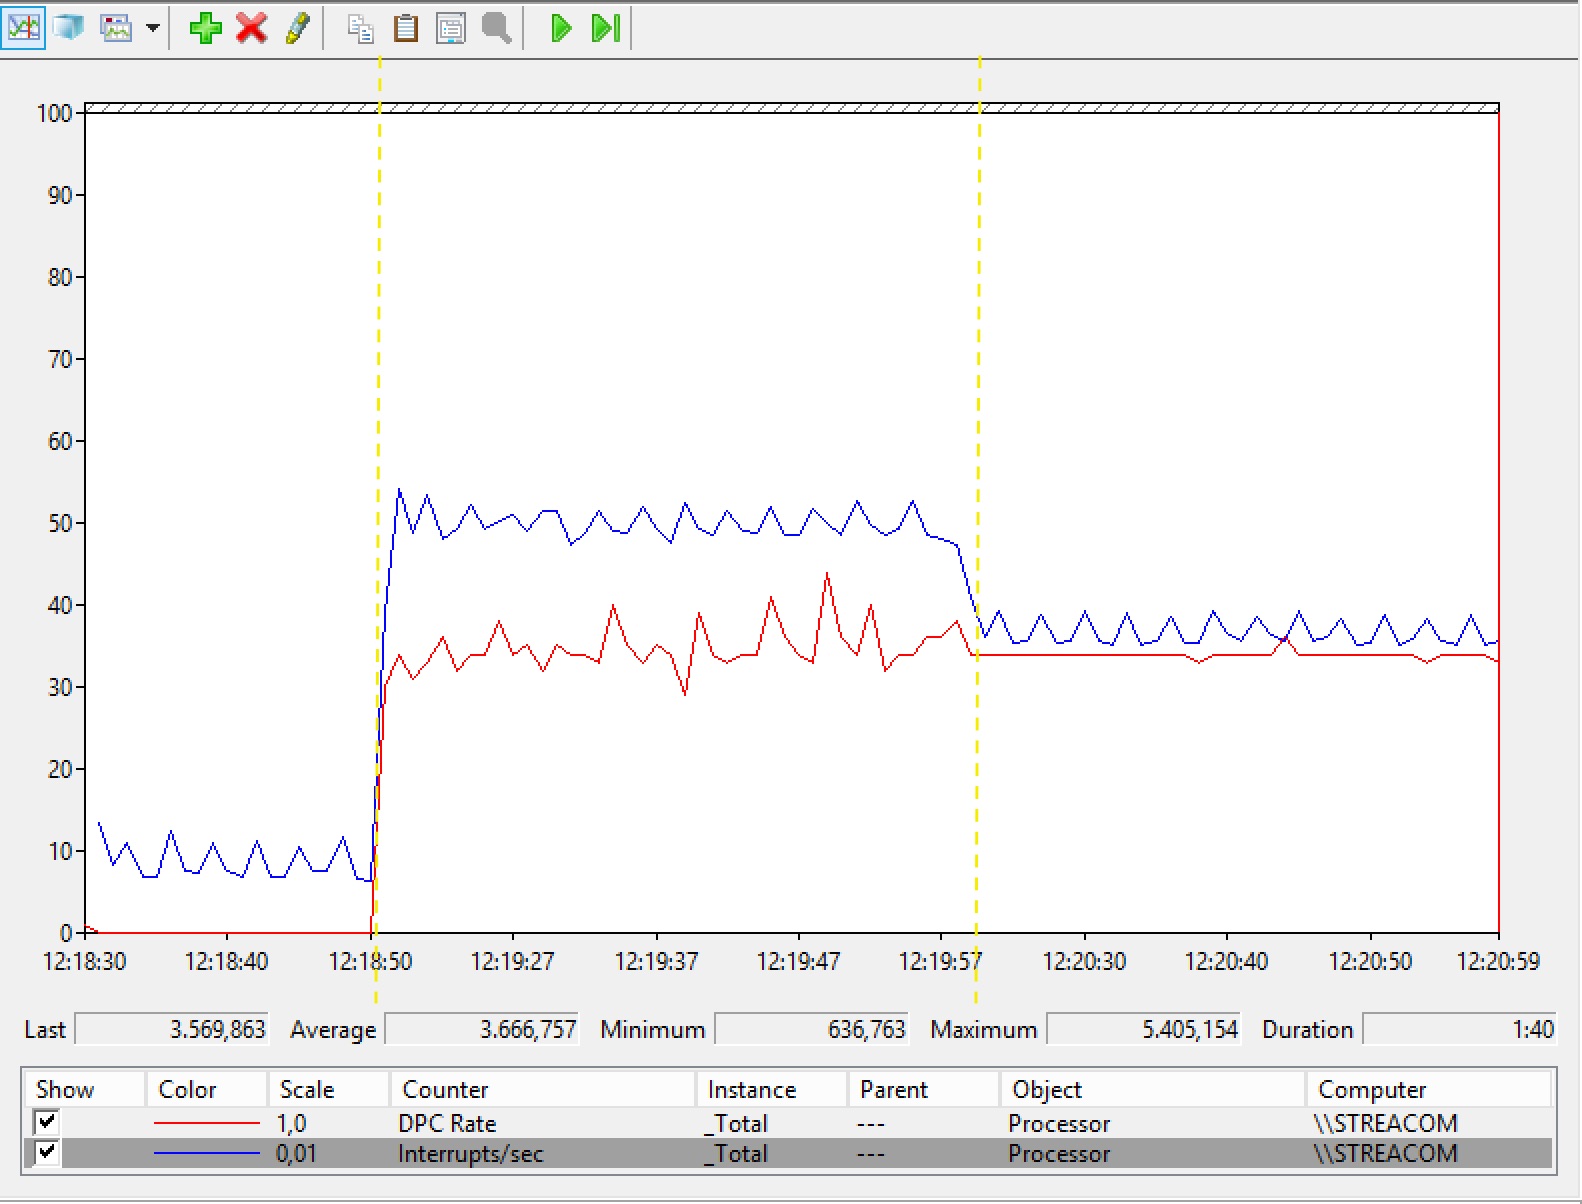
@Jeremy @iliyapolak: I took the following plot with perfmon. To the left of the leftmost yellow vertical line: there is standard activity. Between the two yellow lines: my callback is running with realtime priority but it is still disturbed by the interrupts. To the right of the righmost yellow line: I started bombing data buffers (thus paradoxically increasing the amount of loads and stores, and the overall CPU time that reached 10-15% instead of less than 1%) so that now callback gets the correct attention from the CPU: look at the flat response! It seems to me that the plot says that in short buffers the CPU scheduling matters at least as (or more than) memory/buffers. Hope this clarifies.
- Mark as New
- Bookmark
- Subscribe
- Mute
- Subscribe to RSS Feed
- Permalink
- Report Inappropriate Content
"~5000 interrupts per second" corresponds to ~200us budget time
Assume that copy of 5MB costs ~2.5ms, then copy of 2KB costs ~1us
Assume that 1 interrupt require one 2KB copy, then ~1us out of ~200us is only 0.5% time
Why do you raise this question then?
- Mark as New
- Bookmark
- Subscribe
- Mute
- Subscribe to RSS Feed
- Permalink
- Report Inappropriate Content
If you have time to read the first posts of this 3D I had no idea that it was a CPU scheduling issue, and was asking an explanation. People here helped me to understand. Now we have :)
Thanks
-Roberto
Jeremy W. wrote:
"~5000 interrupts per second" corresponds to ~200us budget time
Assume that copy of 5MB costs ~2.5ms, then copy of 2KB costs ~1us
Assume that 1 interrupt require one 2KB copy, then ~1us out of ~200us is only 0.5% time
Why do you raise this question then?
- Mark as New
- Bookmark
- Subscribe
- Mute
- Subscribe to RSS Feed
- Permalink
- Report Inappropriate Content
Assume that 1 context switching costs your ~50us, they will cost you ~50us * 2 * 5000 = ~0.5s every second
4th gen i7 processor have at least 4 cores, context switching contributes to ~0.5 / 4.0 = ~12.5% cpu time
This cost of context switching can actually be saved by taking advantage of Hyperthreading technology, at the cost of slightly less computing capacity (i.e. non-shared internal resources)
The cost of context switching can also be compensated by using a cpu model with more cores (e.g. 8 cores)
- Mark as New
- Bookmark
- Subscribe
- Mute
- Subscribe to RSS Feed
- Permalink
- Report Inappropriate Content
Thanks, I see your point, I will try to rethink my computation in terms of HT.
Cheers
-Roberto
Jeremy W. wrote:
Assume that 1 context switching costs your ~50us, they will cost you ~50us * 2 * 5000 = ~0.5s every second
4th gen i7 processor have at least 4 cores, context switching contributes to ~0.5 / 4.0 = ~12.5% cpu time
This cost of context switching can actually be saved by taking advantage of Hyperthreading technology, at the cost of slightly less computing capacity (i.e. non-shared internal resources)
The cost of context switching can also be compensated by using a cpu model with more cores (e.g. 8 cores)
- Mark as New
- Bookmark
- Subscribe
- Mute
- Subscribe to RSS Feed
- Permalink
- Report Inappropriate Content
Roberto,
You could experiment with SetThreadAffinityMask(). Call it when the app starts.
I hope on some CPU the DPC call is faster than on all others.
No need to test all available thread mask bits. Since each core is represented by 2 bits (two hyper threads), it's enough to check even bits only.
- Mark as New
- Bookmark
- Subscribe
- Mute
- Subscribe to RSS Feed
- Permalink
- Report Inappropriate Content
Thanks Vladimir for this and the other suggestions you gave me. SetThreadAffinityMask sounds cool, I will study that :)
-R
Vladimir Sedach wrote:
Roberto,
You could experiment with SetThreadAffinityMask(). Call it when the app starts.
I hope on some CPU the DPC call is faster than on all others.No need to test all available thread mask bits. Since each core is represented by 2 bits (two hyper threads), it's enough to check even bits only.
- Subscribe to RSS Feed
- Mark Topic as New
- Mark Topic as Read
- Float this Topic for Current User
- Bookmark
- Subscribe
- Printer Friendly Page
- « Previous
-
- 1
- 2
- Next »