- 신규로 표시
- 북마크
- 구독
- 소거
- RSS 피드 구독
- 강조
- 인쇄
- 부적절한 컨텐트 신고
I am trying to follow the steps from Intel Trace Collector documentation for collecting data about OpenMP regions.
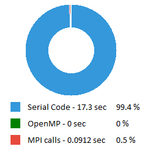
I must be missing something because the resulting trace does not contain any OpenMP information:
I am working on Windows, with Fortran code. I have Intel Parallel Studio XE 2020 Update 2 Cluster Edition for Windows, and Visual Studio 2017.
Here is how I compile and link the code:
> ifort -Qopenmp -trace -openmp -c test.f90
> Link /OUT:test.exe /LIBPATH:"%VT_ROOT%\dll" /SUBSYSTEM:CONSOLE VT.lib impi.lib test.obj
And here is how I run it:
mpiexec -trace -n 2 -genv OMP_NUM_THREADS=8 -genv INTEL_LIBITTNOTIFY64="%VT_ROOT%\dll\VT.dll" test.exe
Does anyone have any idea what could go wrong?
링크가 복사됨
- 신규로 표시
- 북마크
- 구독
- 소거
- RSS 피드 구독
- 강조
- 인쇄
- 부적절한 컨텐트 신고
Hi,
Thanks for reaching out to us.
We tried your code sample and we are also getting the same result with ITAC, so we are forwarding this issue to the concerned team.
Warm Regards,
Abhishek
- 신규로 표시
- 북마크
- 구독
- 소거
- RSS 피드 구독
- 강조
- 인쇄
- 부적절한 컨텐트 신고
Sure, here it is.
Thank you very much for having a look into it.
- 신규로 표시
- 북마크
- 구독
- 소거
- RSS 피드 구독
- 강조
- 인쇄
- 부적절한 컨텐트 신고
You should also verify the program is actually running with openmp.
- 신규로 표시
- 북마크
- 구독
- 소거
- RSS 피드 구독
- 강조
- 인쇄
- 부적절한 컨텐트 신고
The program is indeed running with OpenMP. I can see it in the code output (Hello world from each thread), and even the collected trace detects 2 processes and 16 threads. It simply does not instrument the OpenMP regions.
- 신규로 표시
- 북마크
- 구독
- 소거
- RSS 피드 구독
- 강조
- 인쇄
- 부적절한 컨텐트 신고
Did you try using the directions documented https://software.intel.com/content/www/us/en/develop/documentation/itc-user-and-reference-guide/top/user-guide/recording-openmp-regions-information.html
-
Your application should be:
-
linked with the Intel implementation of OpenMP.
-
-
dynamically linked with theVT.dlllibrary and Intel MPI Library.
-
The example command line to compile the application may look as follows:> mpiicc -trace -openmp myapp.c
-
Make sure theINTEL_LIBITTNOTIFY64environment variable contains the full path to theVT.dlllibrary.
-
Run your application using thempiexeccommand to trace the data.
- 신규로 표시
- 북마크
- 구독
- 소거
- RSS 피드 구독
- 강조
- 인쇄
- 부적절한 컨텐트 신고
Thank you for coming back to me.
Those are the directions I have tried to follow.
Do you mean that the issue does not reproduce on your side? Are you doing anything differently?
From the original post:
Here is how I compile and link the code:
> ifort -Qopenmp -trace -openmp -c test.f90
> Link /OUT:test.exe /LIBPATH:"%VT_ROOT%\dll" /SUBSYSTEM:CONSOLE VT.lib impi.lib test.obj
And here is how I run it:
mpiexec -trace -n 2 -genv OMP_NUM_THREADS=8 -genv INTEL_LIBITTNOTIFY64="%VT_ROOT%\dll\VT.dll" test.exe
- 신규로 표시
- 북마크
- 구독
- 소거
- RSS 피드 구독
- 강조
- 인쇄
- 부적절한 컨텐트 신고
My results are slightly different ...~75% serial 25% MPI calls 0% OMP
I believe this is because loops might be happening too fast for us to collect any samples... but I will verify with team
- 신규로 표시
- 북마크
- 구독
- 소거
- RSS 피드 구독
- 강조
- 인쇄
- 부적절한 컨텐트 신고
All right, thank you very much.
I have tried to profile a real application the same way, and I always get 0s in OpenMP.
- 신규로 표시
- 북마크
- 구독
- 소거
- RSS 피드 구독
- 강조
- 인쇄
- 부적절한 컨텐트 신고
Actually, I think you are right... this looks like a bug to me. I am filing a bug report and we will try to fix in a later version.
Thank you very much for reporting the issue.
Regards
