- Mark as New
- Bookmark
- Subscribe
- Mute
- Subscribe to RSS Feed
- Permalink
- Report Inappropriate Content
Hello,
I’m trying to collect trace information for each thread with Intel Trace Analyzer and Collector.
I'm using Intel OneAPI 2021.1.
I thought that by adding the "-trace" option when compiling a hybrid parallel program, I could check the trace information of each thread with Intel Trace Analyzer as follows.
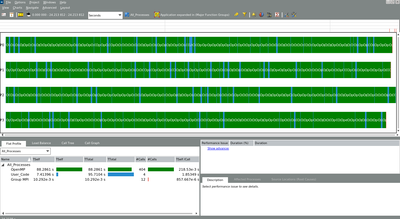
However, in the case of Fortran program, only trace information for each process could be collected as shown below.
Here's how to compile the program.
mpiifort -qopenmp -trace test.f90
And run the program as follows.
mpirun -np 4 -trace ./a.out
Please tell me the correct way to collect trace information for each thread.
Thanks,
1kan
Link Copied
- Mark as New
- Bookmark
- Subscribe
- Mute
- Subscribe to RSS Feed
- Permalink
- Report Inappropriate Content
Hi,
Thanks for reaching out to us.
>>"I thought that by adding the "-trace" option when compiling a hybrid parallel program, I could check the trace information of each thread with Intel Trace Analyzer as follows."
Could you please share us a sample reproducer so that we can investigate your issue well?
>>"However, in the case of Fortran program, only trace information for each process could be collected as shown below."
Could you provide us a fortran reproducer code as well?
Also provide us the steps you followed to reproduce your screenshots using Intel Trace Analyzer and Collector.
Thanks & Regards,
Santosh
- Mark as New
- Bookmark
- Subscribe
- Mute
- Subscribe to RSS Feed
- Permalink
- Report Inappropriate Content
Hi Santosh,
Thanks for your reply, and sorry for my late reply.
>>Could you please share us a sample reproducer so that we can investigate your issue well?
Attach the test code (test.c).
Here are the steps I took:
$ module load itac/2021.1.1 compiler/2021.1.1 mpi/2021.1.1
$ export INTEL_LIBITTNOTIFY64=$VT_ROOT/slib/libVT.so
$ export KMP_FORKJOIN_FRAMES_MODE=0
$ export OMP_NUM_THREADS=4
$ mpiicc -trace -qopenmp test.c
$ mpirun -np 4 ./a.out
$ traceanalyzer a.out.stf
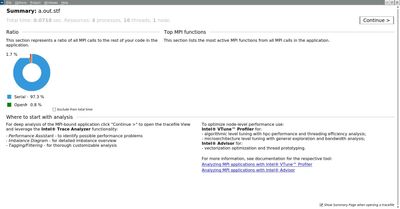
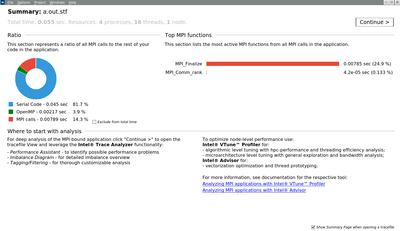
I got the summary screen (the first image attached) by the above procedure.
From the summary screen, I operated
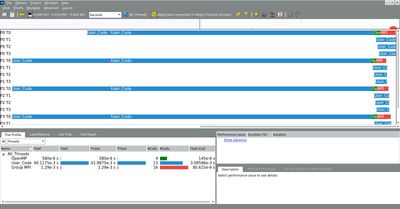
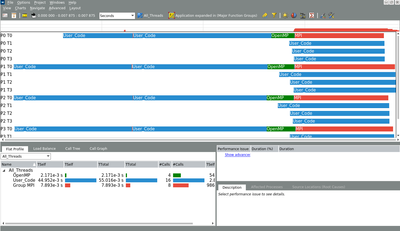
Continue > Charts > Event Timeline > Ungroup Grouped Application
to get the chart for each thread (the second image attached).
>>Could you provide us a fortran reproducer code as well?
Attach the test code (test.f90).
Here are the steps I took:
$ module load itac/2021.1.1 compiler/2021.1.1 mpi/2021.1.1
$ export INTEL_LIBITTNOTIFY64=$VT_ROOT/slib/libVT.so
$ export KMP_FORKJOIN_FRAMES_MODE=0
$ export OMP_NUM_THREADS=4
$ mpiifort -trace -qopenmp test.f90
$ mpirun -np 4 ./a.out
$ traceanalyzer a.out.stf
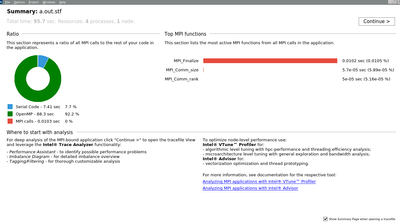
I got the summary screen (the third image attached) by the above procedure.
The operation procedure of Intel Trace Analyzer is the same as that of test.c.
Thank you for your investigation.
Thanks,
1kan
- Mark as New
- Bookmark
- Subscribe
- Mute
- Subscribe to RSS Feed
- Permalink
- Report Inappropriate Content
Hi,
Thanks for providing the sample reproducer along with the steps to reproduce the issue. We are able to reproduce the same issue at our end. We are working on it and will get back to you soon.
Thanks & Regards,
Santosh
- Mark as New
- Bookmark
- Subscribe
- Mute
- Subscribe to RSS Feed
- Permalink
- Report Inappropriate Content
Hi Santosh,
Additional information.
Another Fortran test program(another_test_program.f90) succeeded in collecting trace information for each thread as shown below.
The procedure is the same as for test.f90.
I think that if certain conditions are met, the collection of trace information for each thread may fail.
Can you also investigate under what conditions it will fail ?
Thanks,
1kan
- Mark as New
- Bookmark
- Subscribe
- Mute
- Subscribe to RSS Feed
- Permalink
- Report Inappropriate Content
Hi,
We are discussing with dev team on this issue. I shall post the response as soon as I have some workaround or the fix for this issue.
- Mark as New
- Bookmark
- Subscribe
- Mute
- Subscribe to RSS Feed
- Permalink
- Report Inappropriate Content
Hi,
Do you have any update on this issue?
Thanks,
1kan
- Mark as New
- Bookmark
- Subscribe
- Mute
- Subscribe to RSS Feed
- Permalink
- Report Inappropriate Content
Hi,
I compared programs that succeeded in collecting trace information for each thread with programs that failed.
I confirmed a certain tendency there.
Programs that succeeded in collecting the trace information for each thread include write statement or print statement in the parallel region.
---
!$omp parallel private(omp_id)
omp_id = omp_get_thread_num()
print '(a26, i3, a8, i3)', 'Hello World! I am process ', mpi_id, ' thread ', omp_id
!$omp end parallel
---
Programs that failed to collect trace information for each thread do not include write statement or print statement in the parallel region.
---
!$OMP parallel
!$OMP master
nthread = omp_get_num_threads()
!$OMP end master
!$OMP end parallel
---
Adding write statement or print statement to the parallel region may be a workaround for this issue.
In addition, some programs failed to collect trace information for each thread unless -tcollect option was added when compiling.
$ mpiifort -trace -qopenmp -tcollect test_program.f90
Thank you for your continued investigation.
Thanks,
1kan
- Mark as New
- Bookmark
- Subscribe
- Mute
- Subscribe to RSS Feed
- Permalink
- Report Inappropriate Content
Hi,
I have not been able to root cause why print is helping in this case. Meanwhile - can you try out VTune Profiler which can give per thread performance data and OMP regions? Intel® VTune™ Profiler
- Subscribe to RSS Feed
- Mark Topic as New
- Mark Topic as Read
- Float this Topic for Current User
- Bookmark
- Subscribe
- Printer Friendly Page
