- Mark as New
- Bookmark
- Subscribe
- Mute
- Subscribe to RSS Feed
- Permalink
- Report Inappropriate Content
I've been writing a ray tracer for a few weeks now but I'm now facing a memory corruption issue and I really can't find where it's coming from.
I'm working on Windows 11 22H2 using the Intel oneAPI Base Toolkit and Visual Studio Community 2022 17.7.6.
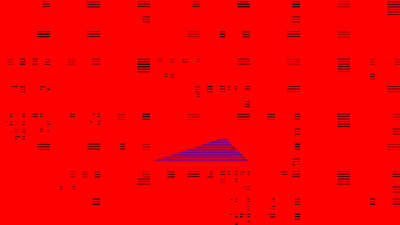
On Windows (desktop PC), the output image is visibly broken.
On Ubuntu 20.04 (using the oenAPI Base Toolkit 2023.2.1), the output image looks fine but I assume the corruption is still present as it (almost always) crashes my Intel driver when using the gpu_selector_v (laptop, integrated Iris Xe).
This corruption issue only arises when compiling in Release mode with optimizations on (/02 on Visual Studio). There seems to be no issues when in Debug mode on Release with optimizations disabled.
I managed to narrow the issue down to a single line of code in render_kernel.cpp:104 called from render_kernel.cpp:60 :
bool RenderKernel::intersect_scene(const Ray ray, HitInfo& closest_hit_info) const
{
    float closest_intersection_distance = -1.0f;
    bool inter_found = false;

    for (int i = 0; i < m_triangle_buffer_access.size(); i++)
    {
        const Triangle& triangle = m_triangle_buffer_access[i];

        HitInfo hit_info;
        if (triangle.intersect(ray, hit_info))
        {
            if (hit_info.t < closest_intersection_distance || !inter_found)
            {
                closest_intersection_distance = hit_info.t;

                ///////////
                closest_hit_info = hit_info; //Problematic line
                ///////////

                inter_found = true;
            }
        }
    }

    return inter_found;
}
On the image above, even the red background has artifacts. If you comment the line that assigns the intersection information to the output 'closest_hit_info' argument (line 18 in the snippet above) you obviously can't see the triangle anymore because the hit information is not updated but the red background also isn't full of artifacts anymore.
Reducing the number of bounces below 4 (render_kernel.h) also makes the issue go away. 4 or 5 bounces always show the artifacts in the output image wheres 3 or less bounces don't any issue. The makes little to no sense as the scene doesn't even have enough geometry for bounces to happen so the execution should be the same with 2 or more bounces.
The full code base can be found in this repo, on the branch "MinimalCorruption". I tried to make it as minimal as possible.
If more details is needed about my system / installation, feel free to ask.
Link Copied
- Mark as New
- Bookmark
- Subscribe
- Mute
- Subscribe to RSS Feed
- Permalink
- Report Inappropriate Content
Hi,
Thank you for posting in Intel Communities.
I have tested the code which was located in the "MinimalCorruption" branch of your GitHub repository.
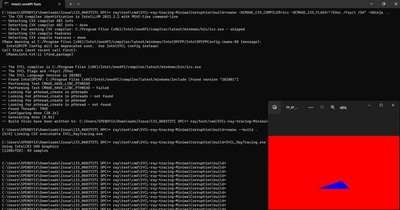
I compiled the code using CMake with both icx Od and O2 optimization, and I successfully obtained a triangle image with a red background as the output, without any artifacts.
Please find the screenshot below.
Could you please share the hardware details of the Windows OS environment where you encountered this issue so that we can investigate the issue from our end?
Thanks and Regards,
Pendyala Sesha Srinivas
- Mark as New
- Bookmark
- Subscribe
- Mute
- Subscribe to RSS Feed
- Permalink
- Report Inappropriate Content
Hi @SeshaP_Intel ,
I managed to compile the code using the same steps that you took with the Intel oneAPI command prompt and I'm still getting the artifacts so the issue doesn't come from Visual Studio (which I used to compile the code for the first message of this post).
Here's a pastebin of a DxDiag on my Windows environment.
- Mark as New
- Bookmark
- Subscribe
- Mute
- Subscribe to RSS Feed
- Permalink
- Report Inappropriate Content
Hi,
Thanks for providing the details of your system. It appears that you're using a non-Intel GPU.
According to the system requirements for the Intel oneAPI DPC++/C++ Compiler, your device is not supported.
Please refer to the below link for more details.
Could you please try running your application on supported hardware and let us know the results?
If you encounter any issues, while running on the supported hardware please provide the following details so we can further investigate the issue from our end:
1. Execute the following command in the Intel oneAPI command prompt and share the screenshot with us:
sycl-ls2. Output screenshot
Thanks and Regards,
Pendyala Sesha Srinivas
- Mark as New
- Bookmark
- Subscribe
- Mute
- Subscribe to RSS Feed
- Permalink
- Report Inappropriate Content
Hi,
Initially, I encountered the issue and the visual artifacts when executing the application on my CPU, not my GPU. I am using an Intel Core i5 13600KF so this should be supported hardware.
Please find below the output of running sycl-ls in the Intel One API command prompt.
- Mark as New
- Bookmark
- Subscribe
- Mute
- Subscribe to RSS Feed
- Permalink
- Report Inappropriate Content
Hi,
We are working on your issue internally. We will get back to you soon.
Thanks and Regards,
Pendyala Sesha Srinivas
- Mark as New
- Bookmark
- Subscribe
- Mute
- Subscribe to RSS Feed
- Permalink
- Report Inappropriate Content
- Mark as New
- Bookmark
- Subscribe
- Mute
- Subscribe to RSS Feed
- Permalink
- Report Inappropriate Content
Hi @TomClabault ,
Apologies for the late response! I will now be helping you in place of Sesha.
I have triaged this case and identified where the Intel compiler is generating bad code. Thank you for your helpful pointers! As you suggested, the issue does originate from source/render_kernel.cpp. Seems to be caused by incorrect loop optimization. The case has been escalated and passed on to the compiler engineers, I will keep you in the loop as they update me.
Hope you are having a good new year!
Cheers!
Ethan
- Subscribe to RSS Feed
- Mark Topic as New
- Mark Topic as Read
- Float this Topic for Current User
- Bookmark
- Subscribe
- Printer Friendly Page


