- Mark as New
- Bookmark
- Subscribe
- Mute
- Subscribe to RSS Feed
- Permalink
- Report Inappropriate Content
Hello,
I want to try HWPGO but I have a problem. My program creating a child process so if I run analyzing, its stuck at Executing process. Is there is any env. flag for analyzing child process?
Thanks!
Link Copied
- Mark as New
- Bookmark
- Subscribe
- Mute
- Subscribe to RSS Feed
- Permalink
- Report Inappropriate Content
Child process sampling behavior depends on which profiling tool you're using for the binary-level sampling.
Unfortunately, if you're using SEP then the "-app" argument serves as the target for internal sample filtering. This means that if the executable named by "-app" launches a different executable then samples in for the child process will be filtered out. For the moment the only workaround is to launch the child process of interest directly with SEP's "-app" and "-args" options.
This something we'd like to improve, possibly by providing a post-mortem HWPGO conversion/filtering tool for SEP's native tb7 output.
If using "perf" (on Linux) the effective filtering should include child processes by default.
@Version001 wrote:its stuck at Executing process.
With that said, SEP should not hang. Is that what you're seeing? If so, can you share how you're invoking it?
- Mark as New
- Bookmark
- Subscribe
- Mute
- Subscribe to RSS Feed
- Permalink
- Report Inappropriate Content
Hello,
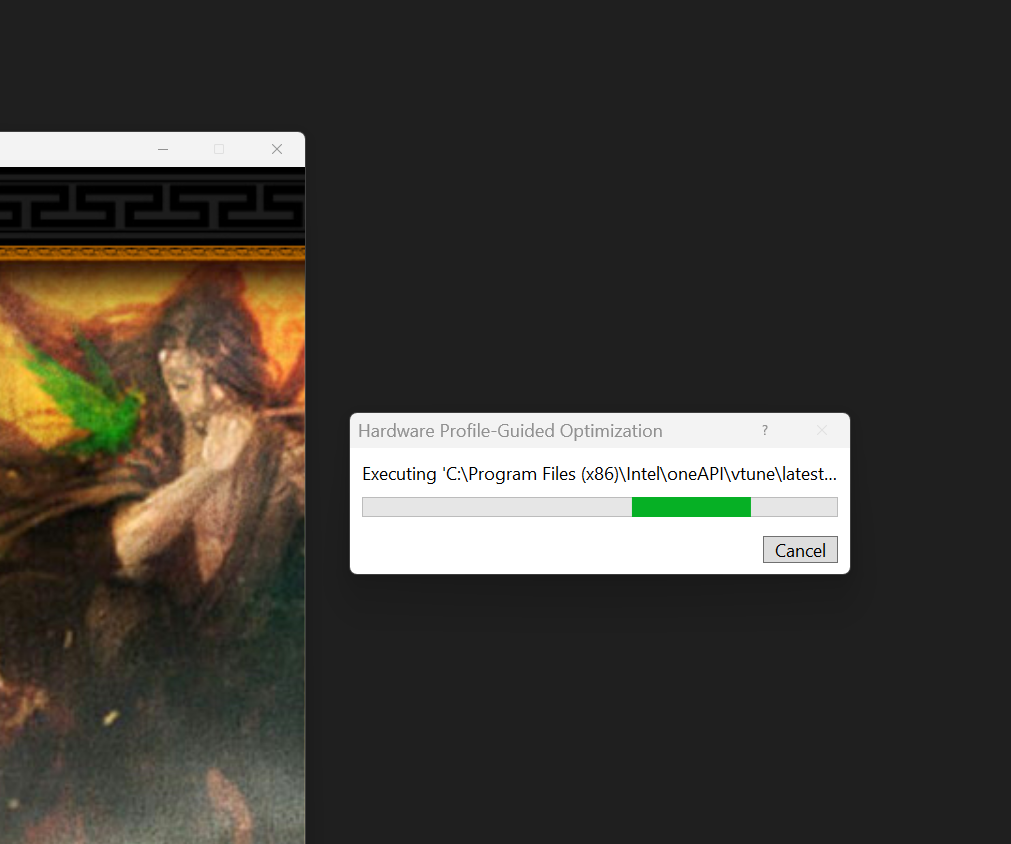
I build with this args (see 1.png) and when running test, my app running but execution process not finishing (see 2.png)
- Mark as New
- Bookmark
- Subscribe
- Mute
- Subscribe to RSS Feed
- Permalink
- Report Inappropriate Content
Thanks. Two follow-up questions:
- When stuck as shown in 2.png, is the TargetPath executable and/or the child process it launches still executing? Are one or both of them using CPU? You may need to consult Task Manager or similar.
- Do results change if you use "/fprofile-sample-generate=keep-all-opt" in 1.png and re-compile/re-profile? I'd advise against "max-fidelity" as this disables virtually all optimizations, and it does not typically improve profile fidelity. (It's mainly useful for identifying cases where optimizations interfere with feedback, but this is the exception.)
- Mark as New
- Bookmark
- Subscribe
- Mute
- Subscribe to RSS Feed
- Permalink
- Report Inappropriate Content
I tried fprofile-sample-generate=keep-all-opt now but its same.
for 1. question, yes my program opening and running normally..
- Mark as New
- Bookmark
- Subscribe
- Mute
- Subscribe to RSS Feed
- Permalink
- Report Inappropriate Content
At this sampling period SEP should not significantly slow or halt the application. Is the application expected to perform some computation and then exit on its own?
When the hang is happening, are both the parent and child process still running?
Have you been able to successfully run the collection (without hang) with a project without the child process arrangement?
- Mark as New
- Bookmark
- Subscribe
- Mute
- Subscribe to RSS Feed
- Permalink
- Report Inappropriate Content
My app is a game, its creating a Python thread with C API for GUI. My game running normally, so problem is just executing not finishing, so hwpgo cant collect infos.
(my game works normally even if the analysis execution gets stuck)
- Mark as New
- Bookmark
- Subscribe
- Mute
- Subscribe to RSS Feed
- Permalink
- Report Inappropriate Content
Have you been able to successfully run the collection (without hang) with a project without the child process arrangement? I am trying to confirm that SEP is working.
If so, could you try profiling your game by invoking it via sep on the command line?
- Mark as New
- Bookmark
- Subscribe
- Mute
- Subscribe to RSS Feed
- Permalink
- Report Inappropriate Content
Yea the problem is probably visual studio based. I can successfully analyze my app via command line..
- Mark as New
- Bookmark
- Subscribe
- Mute
- Subscribe to RSS Feed
- Permalink
- Report Inappropriate Content
Thanks. Yes, it sounds like there is an issue in the Visual Studio plugin's ability to collect the binary profile.
As a workaround you could try to:
1. Produce perf.script output via sep on the command line. Use the options pre-populated in the Visual Studio HWPGO dialogue boxes.
2. Manually invoke llvm-profgen to convert the binary-level profile (perf.script) to an LLVM source-level profile.
3. Finally, select/run only the 3rd phase of HWPGO in Visual Studio where you point the compiler to this profile with "/fprofile-sample-use".
Details on how to run llvm-progen with 2024.2 are available here:
https://www.intel.com/content/www/us/en/docs/dpcpp-cpp-compiler/developer-guide-reference/2024-2/hardware-profile-guided-optimization.html
- Subscribe to RSS Feed
- Mark Topic as New
- Mark Topic as Read
- Float this Topic for Current User
- Bookmark
- Subscribe
- Printer Friendly Page