- Mark as New
- Bookmark
- Subscribe
- Mute
- Subscribe to RSS Feed
- Permalink
- Report Inappropriate Content
Hi,
I've been working for quite a while with 1.5 x64 SDK version since it was released.
Just today I've updated to the latest 2012 x64 SDK.
Details:
What I've noticed is that sometimes while Debbuging you OpenCL code (*.cl)
the position of the current execution line does not corresponds with actual line in the file.
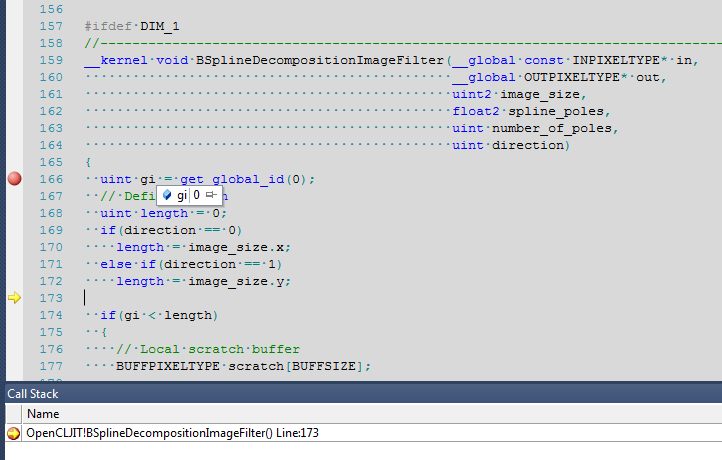
Take a look at my example screenshot. I've placed debug break point at the begin of the kernel.
So, debugger stopped at that break point, but actually it is not there. Only after stepping over 7 lines
variable uint gi = get_global_id(0) will be initialized.
The OpenCLJIT says: OpenCLJIT!BSplineDecompositionImageFilter() Line:173
but actually line uint gi = get_global_id(0); located on 166
Also if the OpenCL function is very simple like this:
float compute(const float index,
__global const INPIXELTYPE* in)
{
return 0.0;
}
You will not be able to put exact breakpoint inside. So, what I have to do is to put
more breakpoints below this function hoping some of them will be triggered.
That is crazy way of working.
I' don't know what is the cause of this problem. I've tried to experiment with Linux/Windows file formats,
tabs vs spaces, removing comments, making all parameters of the functions in one line
float compute(const float index, __global const INPIXELTYPE* in)
No effect. Also for some *cl files all the sudden it is working properly.
Also I can just close my solution and open one of the Intel's examples and it is perfectly fine.
I was hoping that 2012 SDK will solve it, but not :/
This problem still exist both for VisualStudio 9 and 10 in 2012 SDK and 1.5 SDK.
Do you have any ideas what could trigger this behaviour in Intel OpenCL debbuger?
I've attached screenshot from VisualStudio 10
Thanks, Denis

Link Copied
2 Replies
- Mark as New
- Bookmark
- Subscribe
- Mute
- Subscribe to RSS Feed
- Permalink
- Report Inappropriate Content
Hi Denis,
Thanks,
Yuri
I have noticed similar behavior on some of the NVidia samples that preprocess the kernel file to add some "header" text to it. So clCreateProgramWithSource uses modified file while the original is displayed to the user in MS VS.
Could you please check that you pass the same (unmodified) file to clCreateProgramWithSource?
Thanks,
Yuri
- Mark as New
- Bookmark
- Subscribe
- Mute
- Subscribe to RSS Feed
- Permalink
- Report Inappropriate Content
Hi Yuri,
AH! Indead! I am using modified version of the oclUtils.h from NVIDIA
//////////////////////////////////////////////////////////////////////////////
//! Loads a Program file and prepends the cPreamble to the code.
//!
//! @return the source string if succeeded, 0 otherwise
//! @param cFilename program filename
//! @param cPreamble code that is prepended to the loaded file, typically a set of #defines or a header
//! @param szFinalLength returned length of the code string
//////////////////////////////////////////////////////////////////////////////
extern "C" char* oclLoadProgSource(const char* cFilename, const char* cPreamble, size_t* szFinalLength);
In this implementation you are able to prepend cPreamble to the begin of the file, in my case that is:
#define DIM_1
#define BUFFSIZE 4084
#define BUFFPIXELTYPE float
#define INPIXELTYPE short
#define OUTPIXELTYPE float
Thats why I am keep getting this offset! Oh! Did not realize it till you reply :)
Maybe that is good idea to add NOTE somewhere on
http://software.intel.com/en-us/articles/debugging-opencl-kernels-using-intel-opencl-sdk-debugger/
That if you are planing to use debugging, make sure that you have not changed you original code located on disk by adding extra #defines or functions created on the fly, otherwise you will get this type of problem :)
Thanks!
Denis
Reply
Topic Options
- Subscribe to RSS Feed
- Mark Topic as New
- Mark Topic as Read
- Float this Topic for Current User
- Bookmark
- Subscribe
- Printer Friendly Page