- Mark as New
- Bookmark
- Subscribe
- Mute
- Subscribe to RSS Feed
- Permalink
- Report Inappropriate Content
Hi,
How the HW thread level utilization helps in analyzing performance?
How execution occupancy is calculated?
Full kernel execution statistics provide data by varying the local work group size.
How should I interpret this data and do the code changes? Can anyone give me an example?
Any help is appreciated!!
Link Copied
- Mark as New
- Bookmark
- Subscribe
- Mute
- Subscribe to RSS Feed
- Permalink
- Report Inappropriate Content
In general, you want to make sure that all your hardware threads are doing useful work during kernel execution. Let's say you have an Intel Processor with 24 Execution Units (EUs). Each EU has 7 Hardware threads. Each HW thread is capable of executing SIMD8, SIMD16 or SIMD32 instructions, which means you can pack 8, 16, or 32 work items onto a thread depending on the amount of resources consumed by the work item (e.g. private and local memory). At full occupancy, for a kernel compiled in SIMD16 mode (typical size for a regular kernel), the number of work items executing on GPU will be 24*7*16=3024.In reality, over kernel lifetime, some HW threads are underutilized for a variety of reasons: 1) kernel takes some time to ramp up its execution; 2) kernel takes some time to ramp down its execution; 3) when kernel is fully ramped up, only a fraction of all available HW threads could be occupied, e.g. only 4 out of 7 threads for each EU, if there is not enough work.
You can view my videos on various ways of improving occupancy here: https://software.intel.com/en-us/articles/optimizing-simple-opencl-kernels
For more on occupancy metric see links below:
https://software.intel.com/en-us/node/496406
https://software.intel.com/sites/default/files/managed/37/8a/siggraph2014-arkunze.pdf - slide 21
On varying local size of the kernel: you can rely on runtime to select local group size for you or you can use kernel analyzer to run an analysis for you and recommend a specific local group size, which typically gives you better results. You can then hard code that size when enqueueing the kernel. Note, however, that the best work group size could also vary by the size of your input data, so perform your experiments for a range of input data sizes you are planning to support: based on the results of your analysis you may code work group size selection based on input size.
- Mark as New
- Bookmark
- Subscribe
- Mute
- Subscribe to RSS Feed
- Permalink
- Report Inappropriate Content
Thanks a lot Robert!!
I watch your videos and learned about its profiling.
Now I can see there are lot of stalls in the code.
In my code I am not able to see the difference in performance by using Global memory as well as the local memory for the same test vector and code. Can you tell what could be the reason here ?
- Mark as New
- Bookmark
- Subscribe
- Mute
- Subscribe to RSS Feed
- Permalink
- Report Inappropriate Content
Manish,
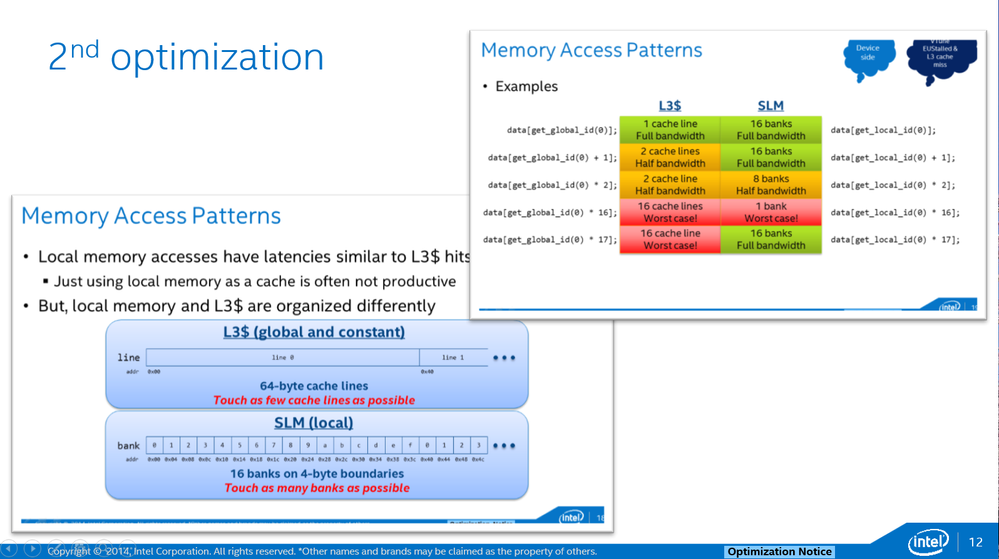
The difference between Local and Global Memory on our architecture is almost non-existent, and performance really depends on proper access patterns (Local memory is highly banked 4 bytes per bank, global memory is accessed in 64 byte cache lines). Consider the following diagram - iin some cases there is literally no difference between local and global memory:
- Subscribe to RSS Feed
- Mark Topic as New
- Mark Topic as Read
- Float this Topic for Current User
- Bookmark
- Subscribe
- Printer Friendly Page
