- Mark as New
- Bookmark
- Subscribe
- Mute
- Subscribe to RSS Feed
- Permalink
- Report Inappropriate Content
Hi,
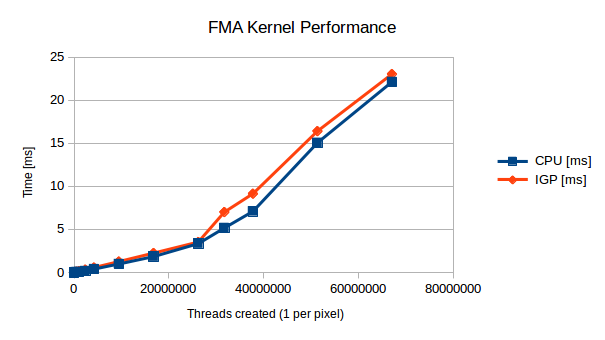
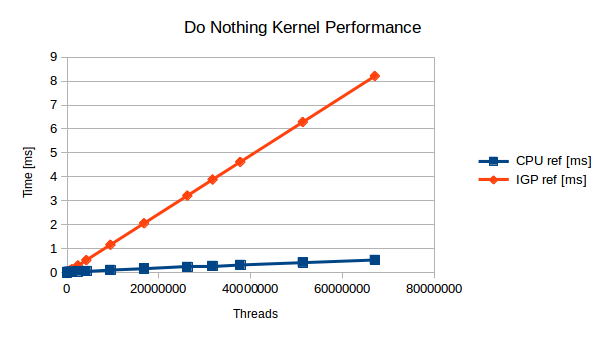
Again, I've been trying to characterize when it makes sense to off load computation from CPU to IGP (i7-5775c CPU vs Iris Pro IGP). I noticed that for very simple kernels (e.g. a single fma, or min/max operation) that the CPU would greatly outperform IGP by up to 50%, and upon investigating it seems that kernel launch overhead has a lot to do with it. Some results to explain:
FMA Kernel (using FMA_LOOP = 1):
void kernel fmaKernel(global float * out){
float sum = out[get_global_id(0)];
for(int i = 0; i < FMA_LOOP; i++){
sum=fma(1.02345, FMA_LOOP.f, sum);
};
out[get_global_id(0)]=sum;
}
Do Nothing Kernel:
void kernel doNothing(global float * out){
return;
}
As a side note, I have forced my IGP to remain at full (1.15 GHz) clock speed. Ditto CPUs (3.7 GHz).
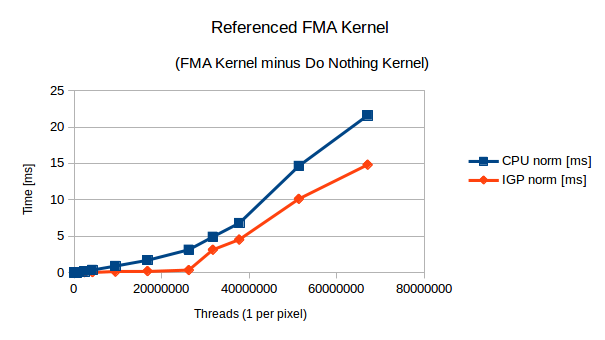
These results all reflect 2D square images (e.g. 32x32, 64x64, 128x128, 512x512, so on), with one thread per pixel.
So I'm led to believe that there's much higher overhead in creating IGP than CPU threads, which is surprising giving that the IGP is supposed to excel at handling lots of threads, and further this overhead is preventing the IGP from really shining in these experiments. I'm guessing what I could do is have each OpenCL thread process more than one pixel, however that requires complicating OpenCL kernels which don't have such great overhead on CPU.
So my question to the forum/Intel is why the overhead is so much greater on IGP than CPU? Or is there something with my experiments that is simply making it appear to be the case, when it can be explained otherwise? I've attempting measuring with OpenCL timers vs. wall clock and don't really see a difference.
Config:
Ubuntu 14.04 LTS
Intel OpenCL 1.2-5.0.0.43 (CPU-x64)
Intel OpenCL 1.2-1.0 (Graphics Driver for HD Graphics, Iris, Iris Pro)
Run benchmark:
./runBench.sh
For my system platform=0=IGP and platform=1=CPU.
Link Copied
- Mark as New
- Bookmark
- Subscribe
- Mute
- Subscribe to RSS Feed
- Permalink
- Report Inappropriate Content
Hi,
The thread launch overhead on a BDW GPU is about 4 ns per thread (the small kernels you are talking about will compile SIMD32, so there will be 32 work items per thread, so when processing 512x512 image you are actually launching 512x512/32=8192 threads, which is consistent with your data in results.csv file). For these really small kernels it does make sense to move to float4 data type on the GPU, e.g.:
 void kernel fmaKernel4(global float4 * out){
   float4 sum = out[get_global_id(0)];
   for(int i = 0; i < FMA_LOOP; i++){
      sum=fma((float4)1.02345f, (float4)FMA_LOOP, sum);
   };
   out[get_global_id(0)]=sum;
 }
You might also want to try float8 kernels (moving to float16 would not make much sense though).
- Mark as New
- Bookmark
- Subscribe
- Mute
- Subscribe to RSS Feed
- Permalink
- Report Inappropriate Content
Interesting, I'll run some experiments tomorrow and see what happens.
I am wondering though, won't using float4 mean we need to create 8x more threads? So is the effective overhead for using float4's less than 4 ns / 8? Also, are these numbers for kernel overhead documented anywhere or is this something I just need to measure (not a big deal, just asking)?
Thanks!
- Mark as New
- Bookmark
- Subscribe
- Mute
- Subscribe to RSS Feed
- Permalink
- Report Inappropriate Content
Using float4 actually means you need to create 4X LESS threads. And using float8 means that you need to create 8X LESS threads. Our architecture is optimized for reading/writing float4s from every work item. For short kernels, float8s are good too.
The thread launch overhead is not documented anywhere: but you actually captured it in your data (we measure it on the architecture side).
- Mark as New
- Bookmark
- Subscribe
- Mute
- Subscribe to RSS Feed
- Permalink
- Report Inappropriate Content
Hi,
Hoping I can revive this thread.I'm wanting to know why increasing the vector width seems to increase kernel execution time.
Per the feedback above, I ran an experiment that tested performance with varying vector sizes for the FMA kernel mentioned in the original post:
Where dummy is the do nothing kernel, and the theoretical calculation assumes 4 ns / thread.
So, indeed, using a vector width of 4 does give better overall improvement. Also, using vectorization does reduce dummy kernel time by a factor of the vector width. What struck me is that kernel execution time, after accounting for thread launch overhead (kernel - dummy), seems to increase with vector width. I used Code Builder to inspect the .gen files created by the build process and noticed that the overall size (assembly count) *mostly* increases with vector width. I'm not sure if this .gen file is a final representation of whats actually executing in the EU. I haven't figured out how to use Code Builder to show how much resources each thread uses, so I'm at a loss to explain the increased kernel timings.
Any thoughts on what I'm observing?
- Mark as New
- Bookmark
- Subscribe
- Mute
- Subscribe to RSS Feed
- Permalink
- Report Inappropriate Content
Hi Logic,
You always bring fun data that requires thinking :) - thanks!
Note 1: your theoretical dummy calculations always assume that increasing width of the vector by 2X decreases the number of threads by 2X, which is not always the case. We have a limited amount of private memory per thread: 4K to be exact, so some of your kernels will be compiled SIMD16 instead of SIMD32 for smaller vector widths, and you will have 2X more threads than you expected. To observe SIMD width, look at compiler output - the Preferred multiple of work-group size is SIMD width:
Maximum work-group size: 256
Compiler work-group size: (0, 0, 0)
Local memory size: 0
Preferred multiple of work-group size: 32
Minimum amount of private memory: 0
Maximum work-group size: 256
Compiler work-group size: (0, 0, 0)
Local memory size: 0
Preferred multiple of work-group size: 16
Minimum amount of private memory: 0
- Subscribe to RSS Feed
- Mark Topic as New
- Mark Topic as Read
- Float this Topic for Current User
- Bookmark
- Subscribe
- Printer Friendly Page


