- Mark as New
- Bookmark
- Subscribe
- Mute
- Subscribe to RSS Feed
- Permalink
- Report Inappropriate Content
I have noticed that IAStorDataMgrSvc.exe leaking handles. Even in a small time frame of a couple of hours you can see it stair step up in a Performance Monitor trace.
The version of the IAStorDataMgrSvc.exe is 10.8.0.1003. Is there an updated verion of this exe or its package?
Anyone else see this issue?
System Information
OS name: Microsoft Windows 7 Ultimate
OS version: 6.1.7601 Service Pack 1 7601
System manufacturer: INTEL_
System model: BGP6710J
Processor: GenuineIntel Intel64 Family 6 Model 42 Stepping 7 3.401 GHz
BIOS: Intel Corp., BGP6710J.86A.2111.2011.1120.2157
Intel® Rapid Storage Technology
Kit installed: 10.8.0.1003
User interface version: 10.8.0.1003
Language: English (United States)
Intel RAID controller: Intel(R) Desktop/Workstation/Server Express Chipset SATA RAID Controller
Number of SATA ports: 6
RAID option ROM version: 10.8.0.1303
Driver version: 11.0.0.1032
ISDI version: 10.8.0.1003
Link Copied
- Mark as New
- Bookmark
- Subscribe
- Mute
- Subscribe to RSS Feed
- Permalink
- Report Inappropriate Content
How many handles? I also use that version, and while I haven't done a trace, I do have Handles added to Task Manager, which should be the same thing. The system has been up 11 days, and the figure is only 1580 for that process. Something else on your system might be interacting with it in some way.
Later versions do leak to this site, but I think they're not released officially via Intel for a reason, so beware.
http://www.station-drivers.com/page/intel%20raid.htm http://www.station-drivers.com/page/intel%20raid.htm
- Mark as New
- Bookmark
- Subscribe
- Mute
- Subscribe to RSS Feed
- Permalink
- Report Inappropriate Content
After 12 hours the IAStorDataMgrSvc.exe is at 1700+ handles.
I dumped the process and do not see anything else in the stack that is interfering with the process.
I have updated the drivers to the latest before this posting. The drivers are not the issue it is the user mode management piece that is slowly bleeding my computer to death.
The leak is manifesting itself within a process that was created and is owned by Intel. This is who needs to come to the table and address the issue.
If Intel does indeed come to the table they and point the finger a someone else the need to provide hard data why it is not their responsibility.
- Mark as New
- Bookmark
- Subscribe
- Mute
- Subscribe to RSS Feed
- Permalink
- Report Inappropriate Content
I'm reminded of the most famous scene in "Crocodile Dundee."
Unless it grows to be a lot higher than 1700 (add another digit), I wouldn't be concerned. Post back tomorrow and let us know what it is then.
My Outlook.exe right now, which I've had running for 8 hours, is close to 2000.
I've seen notable handle leaks before, and they reach much greater heights in much shorter amounts of time. One I remember vividly was some support software that came with Broadcom, and it was over 20K. Skype had the problem once upon a time as well.
- Mark as New
- Bookmark
- Subscribe
- Mute
- Subscribe to RSS Feed
- Permalink
- Report Inappropriate Content
It's a handle leak. 100%
Any process over 1500 handles should be investigated for leaks. I have seen processes run at 24000+ handles but never build. It the leaking that robs you machine of resources.
Considering that when the service is cycled it is at ~250 and the handle count continusly builds over time.
I will post the handle count again tomorrow.
- Mark as New
- Bookmark
- Subscribe
- Mute
- Subscribe to RSS Feed
- Permalink
- Report Inappropriate Content
Are you sure that it's the increasing (which it's doing, but sloooooowly) and not the number itself that matters? Offhand I'd be much more concerned about a task solidly sitting at 24K than one that's approaching 2.5K over nearly two weeks, but I haven't looked into all this for a while. So you're saying if something jumps right to a high number, then resources aren't being consumed to any notable degree as compared to what this service is doing?
I remember in the case of the Broadcom NIC software, it was the "Paged Pool Memory" that increased dramatically along with the handles, and that had a terrible effect on some functions of the machine. MS has a tool called poolmon.exe that I recall using to watch it.
- Mark as New
- Bookmark
- Subscribe
- Mute
- Subscribe to RSS Feed
- Permalink
- Report Inappropriate Content
I am running 10.6.0.1002, and it behaves similarly. I have to agree, this is a problem. Maybe not deserving of the phrase "...bleeding my computer to death...", but still a problem.
It appears that thread handles are not being disposed correctly. After just 5 hours of uptime, IAStorDatMgrSvc is showing 3,414 handles on my machine. It keeps creating threads (and handles for each), but when the threads complete the handles are not released.
This causes the process' working set memory to continually increase as well.
Not a huge problem for someone who reboots every few days, but it could be problematic for a machine that is expected to run for weeks without reboot. I hope Intel finds/fixes it.
- Mark as New
- Bookmark
- Subscribe
- Mute
- Subscribe to RSS Feed
- Permalink
- Report Inappropriate Content
Here is how it stands.
After restarting the machine last night at 8:25:32 PM CST I observed the handle count of the IAStorDataMgrSvc.exe to be at 253.
Log Name: System
Source: EventLog
Date: 2/19/2012 8:25:32 PM
Event ID: 6009
Task Category: None
Level: Information
Keywords: Classic
User: N/A
Computer:
Description:
Microsoft (R) Windows (R) 6.01. 7601 Service Pack 1 Multiprocessor Free.
Less than 8 hours later the handle count is 2155.
The analysis of the thread creation looks to be a possibility. I see the thread count alternate between 10 and 11 threads.
If left unchecked this would eventually resource starve a machine.
- Mark as New
- Bookmark
- Subscribe
- Mute
- Subscribe to RSS Feed
- Permalink
- Report Inappropriate Content
I have a case with Intel support on this issue. I will post the interactions.
- Mark as New
- Bookmark
- Subscribe
- Mute
- Subscribe to RSS Feed
- Permalink
- Report Inappropriate Content
Maybe, maybe not, but enough facts aren't in evidence yet, and restarting the machine didn't help your case. I'm at 2200 in about 12.5 days. Working set memory 21MB, peak 25MB, but I don't think it's the process's RAM that's at issue anyway. Not exactly a 3-alarm situation.
Update: One hour later, no reboot: 1,773....
- Mark as New
- Bookmark
- Subscribe
- Mute
- Subscribe to RSS Feed
- Permalink
- Report Inappropriate Content
Enough facts to convince a Sr. Microsoft engineer to suggest opening a case with Intel.
Any time there is a leak that can be seen in Task Manager it should be addressed.
What OS, Service Pack, and SKU are you running? Is your boot drive a RAID 0 set? Are you using SSD? There are many variables and many different code paths. In my case I have a resource leak. The reason why is not know but since it is in Intel code that's who should make the first effort in determining the source of the failure. Just because you do not see the issue does not mean it does or does not exist.
- Mark as New
- Bookmark
- Subscribe
- Mute
- Subscribe to RSS Feed
- Permalink
- Report Inappropriate Content
It unleaks though, as I amended in my earlier post and as Alan just mentioned. Is yours purely a one-way ticket?
I've had some dealings with support at MS too, and they very much like recommending you to the vendor in question whenever it's not purely MS-related, in this case rightly so. I hope Intel doesn't refer you to MS.
This is a clean W7 x64 SP1 from late last year. 8GB RAM. I am using SSD, but just as a normal SSD (i.e. not a caching drive). No RAID.
- Mark as New
- Bookmark
- Subscribe
- Mute
- Subscribe to RSS Feed
- Permalink
- Report Inappropriate Content
If it maintains control of the handles and periodically releases them (as it appears to do on my system), then it is not a really a "leak." It might not be the most efficient design, or there might be a really good reason for a periodic reclamation vs incremental reclamation.
Take this from a senior software engineer that worked somewhere with much tighter standards than Microsoft. And keep in mind, support staff at CompanyA are always supportive of you opening a case with the staff at CompanyB. And vice versa. :-)
That said, you have a different system and may indeed have a problem -- I don't know. But I suggest (again) a perfmon trace of IAStorMgrSvc handle consumption that spans several hours to see whether there is constant growth (which would indicate a leak) or cyclic growth/reduction within bounds -- which would indicate that the application is maintaining record of handles and releasing them in a managed way.
Either way, good luck and let us know what you find.
- Mark as New
- Bookmark
- Subscribe
- Mute
- Subscribe to RSS Feed
- Permalink
- Report Inappropriate Content
I am in the process of doing a Perfmon for at least 24 hours that you and Alan had suggested and will post the results. We will see if this is the same as what you both have seen. If it is managing itself then I will just leave it. Really I hope this is the case.
Thanks for your input and guidance.
Stay tuned...
- Mark as New
- Bookmark
- Subscribe
- Mute
- Subscribe to RSS Feed
- Permalink
- Report Inappropriate Content
So far you are on the money. The full 24 hour Perfmon should tell the full tale.
- Mark as New
- Bookmark
- Subscribe
- Mute
- Subscribe to RSS Feed
- Permalink
- Report Inappropriate Content
Toddmaxx,
I rebooted my machine this morning, and have monitored the IAStoreDataMgrSvc handles since that time.
It gradually increases at a steady rate of about 600-700 handles per hour. It eventually peaks, immediately falls back to a lower value, then begins increasing again. This cycle repeats.
Here are the last three cycles:
Peak 3,181 at 2:50pm, fell back to 1,483.
Peak 3,235 at 5:19pm, fell back to 1,779.
Peak 3.525 at 7:46pm, fell back to 1,778.
A little early to tell (more cycles needed), but that's two cycles where it went back to the 1778/1779 level after 2.5 hours of increase.
Hopefully your 24-hour monitoring will show something similar. Let us know what you see!
- Mark as New
- Bookmark
- Subscribe
- Mute
- Subscribe to RSS Feed
- Permalink
- Report Inappropriate Content
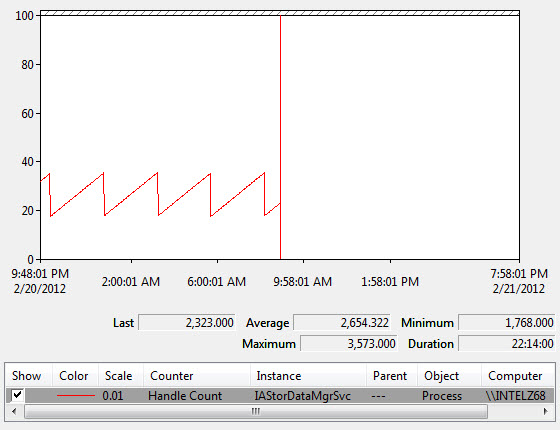
OK this was only about 12 hours of data but it did verify the behavior as described.
So I have to wonder what Intel is doing that would warrent the creation of a piece of code that can easily be mistaken for leaky code.
Thank you both for your assistance.
- Mark as New
- Bookmark
- Subscribe
- Mute
- Subscribe to RSS Feed
- Permalink
- Report Inappropriate Content
Todd,
Your graph looks just like mine -- although you are hitting a slightly higher maximum, 3,642 vs my max of 3,573. New threads are regularly being spawned and die quickly, but the thread handles are cleaned up "en masse" every couple hours.
Seems strange, but there is likely a really good reason for it as Intel has a lot of experience with this software. There are likely other activities happening at the same time that we aren't seeing; perhaps some kind of history/logging function that aggregates thread status / results every couple hours, then disposes the thread handles (and other thread-specific result/status info) at that time. The designer probably decided that function was better performed periodically rather than incrementally. But of course that is all just speculation on my part.
In any case, this forum thread and your graph should be of help to others in future who notice the increasing handle count and become concerned.
Edit -- Attaching copy of my perfmon chart as well.
Message was edited by: Alan Scott
- Mark as New
- Bookmark
- Subscribe
- Mute
- Subscribe to RSS Feed
- Permalink
- Report Inappropriate Content
After watching this a while, it appears that IAStorDataMgrSvc does a periodic cleanup/release of handles. At least that is what I see happening on my machine. YMMV.
I noticed this once while just looking at current handle count in TaskMgr. So I setup a perfmon session to monitor it over time. It shows the service slowly increasing handle usage -- until it gets to around 3400. Every time it gets close to 3400, it quickly drops back to about 1600. Then it starts slowly building up again, gets close to 3400, and quickly drops back to 1600. I watched this several times. (Snapshot attached showing one example.)
When I dump the process, there are tons of thread handles for threads that no longer exist. Hence my earlier comment that the service is is creating threads, but not releasing the thread handles as each thread completes. But it does seem to periodically release the old handles.
Just for comparison, MS Outlook grabs over 5,000 handles at startup, and ccsvchost (Norton AV) routinely holds 3,500 or more.
As long as it periodically releases the handles and keeps itself under a reasonable threshold, I don't see it creating any long-term problem with resource usage. You may want to setup perfmon to capture activity over several hours, and see if it acts the same way on your machine.
- Subscribe to RSS Feed
- Mark Topic as New
- Mark Topic as Read
- Float this Topic for Current User
- Bookmark
- Subscribe
- Printer Friendly Page