- Mark as New
- Bookmark
- Subscribe
- Mute
- Subscribe to RSS Feed
- Permalink
- Report Inappropriate Content
I am attempting to determine what is causing an embedded industrial computer (ARK-1550-S9A1E) with Intel 4th Gen Core i5-4300U Dual Core to scale down all the cores to around ~200 MHz from 1.90 GHz
There is several utilities/tools (turbostat or msr) tools that indicate that the reason it has scaled down is because of ThermStatus and "Digital Readout" shows 65 C/149 F.
The device itself is running Ubuntu 18.04 LTS server (no GUI, headless application) and the applications running on it are at most taking 20% of the CPU. There is nothing really to spike up this CPU utilization, so it is incredibly surprising that it is overheating. It is an industrial fan-less PC, so it does have a lot of hardware to dissipate heat.
Below is the output form MSR and turbostat for all the detail regarding the register readings.
user1@ubuntu-18.04_64:~$ cat /proc/cpuinfo | grep "MHz"
cpu MHz		: 230.404
cpu MHz		: 227.324
cpu MHz		: 217.117
cpu MHz		: 174.135
user1@ubuntu-18.04_64:~$

user1@ubuntu-18.04_64:~$ cat /sys/devices/system/cpu/cpu*/cpufreq/scaling_governor
performance
performance
performance
performance
user1@ubuntu-18.04_64:~$

user1@ubuntu-18.04_64:~$ sudo rdmsr 0x770 -f 63:0
rdmsr: CPU 0 cannot read MSR 0x00000770
user1@ubuntu-18.04_64:~$ sudo rdmsr 0x771 -f 63:0
rdmsr: CPU 0 cannot read MSR 0x00000771
user1@ubuntu-18.04_64:~$ sudo rdmsr 0x772 -f 63:0
rdmsr: CPU 0 cannot read MSR 0x00000772
user1@ubuntu-18.04_64:~$ sudo rdmsr 0x773 -f 63:0
rdmsr: CPU 0 cannot read MSR 0x00000773
user1@ubuntu-18.04_64:~$ sudo rdmsr 0x775 -f 63:0
rdmsr: CPU 0 cannot read MSR 0x00000775
user1@ubuntu-18.04_64:~$ sudo rdmsr 0x777 -f 63:0
rdmsr: CPU 0 cannot read MSR 0x00000777
user1@ubuntu-18.04_64:~$ sudo rdmsr 0x19C -f 63:0
88410800
user1@ubuntu-18.04_64:~$ sudo rdmsr 0x64E -f 63:0
rdmsr: CPU 0 cannot read MSR 0x0000064e
user1@ubuntu-18.04_64:~$ sudo rdmsr 0x64F -f 63:0
rdmsr: CPU 0 cannot read MSR 0x0000064f
user1@ubuntu-18.04_64:~$ sudo rdmsr 0x19B -f 63:0
13
user1@ubuntu-18.04_64:~$

user1@ubuntu-18.04_64$ ./intel-reg-pp.out
hello from intel_reg_pp!

[19CH] IA32_THERM_STATUS Register With HWP Feedback
  Command to read: sudo rdmsr 0x19c - f 63:0
Value of register is: 88410800
  64  60        50        40        30        20        10
  43210987654321098765432109876543210987654321098765432109876543210
0b00000000000000000000000000000000010001000010000010000100000000000
  └───────────────┬───────────────┘│└─┬┘└─┬┘└──┬──┘││││││││││││││││
              Reserved             │  │   │    │   ││││││││││││││││
Reading Valid ─────────────────────┘  │   │    │   ││││││││││││││││
Reading in Deg. Celcius ──────────────┘   │    │   ││││││││││││││││
Reserved ─────────────────────────────────┘    │   ││││││││││││││││
Digital Readout ───────────────────────────────┘   ││││││││││││││││ 65 C -> 149 F
Cross-domain Limit Log ────────────────────────────┘│││││││││││││││
Cross-domain Limit Status ──────────────────────────┘││││││││││││││
Current Limit Log ───────────────────────────────────┘│││││││││││││
Current Limit Status ─────────────────────────────────┘││││││││││││
Power Limit Notification Log ──────────────────────────┘│││││││││││
Power Limit Notification Status ────────────────────────┘││││││││││
Thermal Threshold #2 Log ────────────────────────────────┘│││││││││
Thermal Threshold #2 Status ──────────────────────────────┘││││││││
Thermal Threshold #1 Log ──────────────────────────────────┘│││││││
Thermal Threshold #1 Status ────────────────────────────────┘││││││
Critical Temperature Log ────────────────────────────────────┘│││││
Critical Temperature Status ──────────────────────────────────┘││││
PROCHOT# or FORCEPR# Log ──────────────────────────────────────┘│││
PROCHOT# or FORCEPR# Event ─────────────────────────────────────┘││
Thermal Status Log ──────────────────────────────────────────────┘│
Thermal Status ───────────────────────────────────────────────────┘


[64FH] MSR_CORE_PERF_LIMIT_REASONS
  Command to read: sudo rdmsr 0x64f - f 63:0
Value of register is: 1c220002
  64  60        50        40        30        20        10
  43210987654321098765432109876543210987654321098765432109876543210
0b00000000000000000000000000000000000011100001000100000000000000010
   └───────────────┬───────────────┘││││││└─┬─┘│││││││││││└─┬─┘││││
              Reserved              ││││││  │  │││││││││││  │  ││││
Maximum Efficiency Frequency Log ───┘│││││  │  │││││││││││  │  ││││
Turbo Transistion Attenuation Log ───┘││││  │  │││││││││││  │  ││││
Electical Design Point Log ───────────┘│││  │  │││││││││││  │  ││││
Max Turbo Limit Log ───────────────────┘││  │  │││││││││││  │  ││││
VR Them Alert Log ──────────────────────┘│  │  │││││││││││  │  ││││
Core Power Limiting Log ─────────────────┘  │  │││││││││││  │  ││││
Reserved ───────────────────────────────────┘  │││││││││││  │  ││││
Package-Level PL2 Power Limiting Log ──────────┘││││││││││  │  ││││
Package-Level PL1 Power Limiting Log ───────────┘│││││││││  │  ││││
Thermal Log ─────────────────────────────────────┘││││││││  │  ││││
PROCHOT Log ──────────────────────────────────────┘│││││││  │  ││││
Reserved ──────────────────────────────────────────┘││││││  │  ││││
Maximum Efficiency Frequency Status (R0)────────────┘│││││  │  ││││
Turbo Transition Attenuation Status (R0)─────────────┘││││  │  ││││
Electrical Design Point Status (R0)───────────────────┘│││  │  ││││
Max Turbo Limit Status (R0) ───────────────────────────┘││  │  ││││
VR Therm Alert Status (R0)──────────────────────────────┘│  │  ││││
Core Power Limiting Status (R0)──────────────────────────┘  │  ││││
Reserved ───────────────────────────────────────────────────┘  ││││
Package-Level PL2 Power Limiting Status (R0) ──────────────────┘│││
Package-Level Power Limiting PL1 Status (R0)────────────────────┘││
Thermal Status (R0) ─────────────────────────────────────────────┘│
PROCHOT Status (R0) ──────────────────────────────────────────────┘


[19BH] IA32_THERM_INTERRUPT
  Command to read: sudo rdmsr 0x64f - f 63:0
Value of register is: 00000013
  64  60        50        40        30        20        10
  43210987654321098765432109876543210987654321098765432109876543210
0b10000000000000000000000000000000000000000000000000000000000010011
   └───────────────┬──────────────────────┘│└──┬──┘│└──┬──┘└┬┘│││││
              Reserved                     │   │   │   │    │ │││││
Threshold #2 INT Enable ───────────────────┘   │   │   │    │ │││││
Threshold #2 Value ────────────────────────────┘   │   │    │ │││││
Threshold #1 INT Enable ───────────────────────────┘   │    │ │││││
Threshold #1 Value ────────────────────────────────────┘    │ │││││
Reserved ───────────────────────────────────────────────────┘ │││││
Critical Temperature Enable ──────────────────────────────────┘││││
FORCEPR# INT Enable ───────────────────────────────────────────┘│││
PROCHOT# INT enable ────────────────────────────────────────────┘││
Low-Temperature INT enable ──────────────────────────────────────┘│
High-Temperature INT Enable ──────────────────────────────────────┘
user1@ubuntu-18.04_64:~/projects/intel-reg-pp/bin/x86/Debug$


user1@ubuntu-18.04_64:~$ sudo turbostat
turbostat version 17.06.23 - Len Brown <lenb@kernel.org>
CPUID(0): GenuineIntel 13 CPUID levels; family:model:stepping 0x6:45:1 (6:69:1)
CPUID(1): SSE3 MONITOR SMX EIST TM2 TSC MSR ACPI-TM TM
CPUID(6): APERF, TURBO, DTS, PTM, No-HWP, No-HWPnotify, No-HWPwindow, No-HWPepp, No-HWPpkg, EPB
cpu3: MSR_IA32_MISC_ENABLE: 0x00850089 (TCC EIST No-MWAIT PREFETCH TURBO)
CPUID(7): No-SGX
cpu3: MSR_MISC_PWR_MGMT: 0x00400000 (ENable-EIST_Coordination DISable-EPB DISable-OOB)
RAPL: 17476 sec. Joule Counter Range, at 15 Watts
cpu3: MSR_PLATFORM_INFO: 0x8083df3011900
8 * 100.0 = 800.0 MHz max efficiency frequency
25 * 100.0 = 2500.0 MHz base frequency
cpu3: MSR_IA32_POWER_CTL: 0x0004005d (C1E auto-promotion: DISabled)
cpu3: MSR_TURBO_RATIO_LIMIT: 0x1a1a1a1d
26 * 100.0 = 2600.0 MHz max turbo 4 active cores
26 * 100.0 = 2600.0 MHz max turbo 3 active cores
26 * 100.0 = 2600.0 MHz max turbo 2 active cores
29 * 100.0 = 2900.0 MHz max turbo 1 active cores
cpu3: MSR_CONFIG_TDP_NOMINAL: 0x00000013 (base_ratio=19)
cpu3: MSR_CONFIG_TDP_LEVEL_1: 0x0008005c (PKG_MIN_PWR_LVL1=0 PKG_MAX_PWR_LVL1=0 LVL1_RATIO=8 PKG_TDP_LVL1=92)
cpu3: MSR_CONFIG_TDP_LEVEL_2: 0x001900c8 (PKG_MIN_PWR_LVL2=0 PKG_MAX_PWR_LVL2=0 LVL2_RATIO=25 PKG_TDP_LVL2=200)
cpu3: MSR_CONFIG_TDP_CONTROL: 0x00000000 ( lock=0)
cpu3: MSR_TURBO_ACTIVATION_RATIO: 0x00000012 (MAX_NON_TURBO_RATIO=18 lock=0)
cpu3: MSR_PKG_CST_CONFIG_CONTROL: 0x1e008408 (UNdemote-C3, UNdemote-C1, demote-C3, demote-C1, locked: pkg-cstate-limit=8: unlimited)
cpu3: POLL: CPUIDLE CORE POLL IDLE
cpu3: C1: MWAIT 0x00
cpu3: C1E: MWAIT 0x01
cpu3: C3: MWAIT 0x10
cpu3: C6: MWAIT 0x20
cpu3: C7s: MWAIT 0x32
cpu3: C8: MWAIT 0x40
cpu3: C9: MWAIT 0x50
cpu3: C10: MWAIT 0x60
cpu3: cpufreq driver: intel_pstate
cpu3: cpufreq governor: performance
cpufreq intel_pstate no_turbo: 0
cpu3: MSR_MISC_FEATURE_CONTROL: 0x00000000 (L2-Prefetch L2-Prefetch-pair L1-Prefetch L1-IP-Prefetch)
cpu0: MSR_IA32_ENERGY_PERF_BIAS: 0x00000006 (balanced)
cpu0: MSR_CORE_PERF_LIMIT_REASONS, 0x1c220002 (Active: ThermStatus, ) (Logged: MultiCoreTurbo, PkgPwrL2, PkgPwrL1, Auto-HWP, ThermStatus, )
cpu0: MSR_GFX_PERF_LIMIT_REASONS, 0x14020002 (Active: ThermStatus, ) (Logged: ThermStatus, PkgPwrL1, )
cpu0: MSR_RING_PERF_LIMIT_REASONS, 0x0c020000 (Active: ) (Logged: ThermStatus, PkgPwrL1, PkgPwrL2, )
cpu0: MSR_RAPL_POWER_UNIT: 0x000a0e03 (0.125000 Watts, 0.000061 Joules, 0.000977 sec.)
cpu0: MSR_PKG_POWER_INFO: 0x00000078 (15 W TDP, RAPL 0 - 0 W, 0.000000 sec.)
cpu0: MSR_PKG_POWER_LIMIT: 0x804280c800dd80c8 (locked)
cpu0: PKG Limit #1: ENabled (25.000000 Watts, 28.000000 sec, clamp ENabled)
cpu0: PKG Limit #2: ENabled (25.000000 Watts, 0.002441* sec, clamp DISabled)
cpu0: MSR_PP0_POLICY: 0
cpu0: MSR_PP0_POWER_LIMIT: 0x00000000 (UNlocked)
cpu0: Cores Limit: DISabled (0.000000 Watts, 0.000977 sec, clamp DISabled)
cpu0: MSR_PP1_POLICY: 0
cpu0: MSR_PP1_POWER_LIMIT: 0x00000000 (UNlocked)
cpu0: GFX Limit: DISabled (0.000000 Watts, 0.000977 sec, clamp DISabled)
cpu0: MSR_IA32_TEMPERATURE_TARGET: 0x00640000 (100 C)
cpu0: MSR_IA32_PACKAGE_THERM_STATUS: 0x88400800 (36 C)
cpu0: MSR_IA32_PACKAGE_THERM_INTERRUPT: 0x00000003 (100 C, 100 C)
cpu3: MSR_PKGC3_IRTL: 0x00008842 (valid, 67584 ns)
cpu3: MSR_PKGC6_IRTL: 0x00008873 (valid, 117760 ns)
cpu3: MSR_PKGC7_IRTL: 0x00008891 (valid, 148480 ns)
cpu3: MSR_PKGC8_IRTL: 0x000088e4 (valid, 233472 ns)
cpu3: MSR_PKGC9_IRTL: 0x00008945 (valid, 332800 ns)
cpu3: MSR_PKGC10_IRTL: 0x000089ef (valid, 506880 ns)
Core	CPU	Avg_MHz	Busy%	Bzy_MHz	TSC_MHz	IRQ	SMI	C1	C1E	C3	C6	C7s	C8	C9	C10	C1%	C1E%	C3%	C6%	C7s%	C8%	C9%	C10%	CPU%c1	CPU%c3	CPU%c6	CPU%c7	CoreTmp	PkgTmp	GFX%rc6	Pkg%pc2	Pkg%pc3	Pkg%pc6	Pkg%pc7	Pkg%pc8	Pkg%pc9	Pk%pc10	PkgWatt	CorWattGFXWatt
-	-	157	69.94	225	2494	22821	0	447	1810	8751	389	1496	971	329	5	0.09	0.73	11.99	1.14	6.28	7.17	3.16	0.00	20.58	6.78	0.25	2.46	35	36	99.38	0.00	0.00	0.00	0.00	0.00	0.00	0.00	2.67	0.22	0.00
0	0	151	64.78	233	2494	6150	0	139	547	2166	145	501	335	80	0	0.11	0.94	11.59	1.74	8.75	9.61	3.02	0.00	22.16	9.01	0.30	3.75	35	36	99.38	0.00	0.00	0.00	0.00	0.00	0.00	0.00	2.67	0.22	0.00
0	2	146	68.06	216	2494	6206	0	120	418	2532	82	362	229	96	2	0.09	0.66	13.98	0.88	5.84	7.01	4.02	0.00	18.88
1	1	202	87.77	231	2494	3457	0	68	206	876	35	153	104	34	2	0.07	0.34	4.57	0.41	2.46	3.30	1.27	0.00	6.32	4.55	0.19	1.17	35
1	3	128	59.14	217	2494	7008	0	120	639	3177	127	480	303	119	1	0.09	1.00	17.82	1.52	8.09	8.76	4.33	0.00	34.95
^C
user1@ubuntu-18.04_64:~$
What would be a good way of determining what is causing this frequency scaling down from 1.9 GHz to 200 MHz?
Link Copied
- Mark as New
- Bookmark
- Subscribe
- Mute
- Subscribe to RSS Feed
- Permalink
- Report Inappropriate Content
I don't usually trust the values in /proc/cpuinfo as a frequency measurement, but the matching values from turbostat (your lines 185-190) suggest that they are in the right ballpark. (My preferred frequency test is a "spinner" program that reads the TSC and fixed-function cycle counters, does a billion additions, reads the counters, prints the deltas, and repeats until killed. A lower-power variant executes a loop of PAUSE instructions instead of doing additions. The program must be bound to a single logical processor for differences low-level reads of fixed-function cycle counters to make sense.)
The documentation for these mechanisms is sometimes very challenging to follow -- partly because there are so many mechanisms, with so many variations over time. The reader often has to guess which pieces of documentation apply to the processor being discussed plus all future mores, or just the processor models mentioned explicitly.
In Volume 3 of the Intel Architectures SW Developers Manual (document 325384-070, May 2019), section 14.7.5.2 "Reading the Digital Sensor" notes that the 7-bit "digital readout" field in the IA32_THERM_STATUS register indicates the number of degrees below the TCC Activation Temperature. For your processor, MSR_IA32_TEMPERATURE_TARGET shows that the TCC Activation Temperature is 100 C, so the "digital readout" value of 65 indicates a temperature of (100-65) = 35 C. This is in agreement with the value of 36 C on line 177 of your output (where the "digital readout" of the corresponding IA32_THERM_STATUS MSR is 0x40=64 decimal).
The IA32_TEMPERATURE_TARGET supports an optional field (bits 27:24) to activate thermal throttling at a lower temperature, but this field is set to zero on your box.
The output of intel-reg-pp is a bit misleading in some places....
IA32_THERM_STATUS: In lines 37-67 above, the field described on line 49 labeled "Reading in Deg. Celcius" is actually the resolution of the temperature sensor in degrees Celcius. The reported value of 1 degree is the only value I have seen on various Intel processors. The "digital readout" described in line 51 is 0x41 = 65 decimal, which corresponds to 100-65 = 35C, as I discussed above. The other interesting bit is bit 11, the "Power Limit Notification Log" (line 56), which indicates that the processor has experienced power throttling since the last reset. None of the other log or status bits are set, so there is not much suggestion of trouble here. I am a bit confused by line 41 -- this MSR has a scope of "core", so you really should specify which core to use in the rdmsr command -- something like:
for CORE in 0 1 2 3; do sudo rdmsr -p $CORE 0x19c -f 63:0; done
This is probably not relevant in your case, but it is generally a good idea to understand the scope of MSRs so that you can be sure to read all the values that might be independent. The tool should also be smart enough to recognize that HWP is disabled (as you saw in lines 15-16), so bits 15:12 are "reserved".
MSR_CORE_PERF_LIMIT_REASONS (MSR 0x64f) (lines 70-100) also has core scope and the rdmsr command should specify which core you wish to query. One issue that may be confusing here is that this MSR name is associated with MSR 0x690 in this processor family, not MSR 0x64f -- see Table 2-30 in Volume 4 of the Intel Architectures SW Developers Manual (document 335592-070, May 2019). Since MSR 0x64f is not documented for the Haswell processors (only for Goldmont, and then again starting with the Skylake microarchitecture), it may not be reliable. With that caveat, the MSR 0x64f value of 0x1c220002 includes an active "thermal status" bit, even though the previous IA32_THERM_STATUS output showed no "thermal status" or "thermal log". This may be because the commands were not run on the same core? I would certainly want to read both of these using "rdmsr -p $CORE" to see if the values of "thermal status" and "thermal log" are consistent between these two MSRs when run on the same core. The next bit set in MSR_CORE_PERF_LIMIT_REASONS is bit 17 "thermal log" -- this will always be set if the "thermal status" bit is set. Bits 24:20 are labeled as "reserved", in agreement with the Goldmont implementation of MSR 0x64f, but since bit 21 is set, it makes sense to look around a bit more for clues. In the Haswell entry for MSR 0x690, bit 21 is labelled "Autonomous Utilization-Based Frequency Control Log", which I have never heard of, but which appears to apply to all Haswell and Broadwell cores. But the next use of MSR 0x64f is in Skylake, where bit 21 is documented as "Running Average Thermal Limit Log" -- another mechanism that I had not previously heard of.... I would recommend using rdmsr to read the documented MSR number (0x690) on each core, since Intel is unlikely to provide guidance on the meaning of bit fields in an MSR that is undocumented on your processor (0x64f). Anyway, the reported value also shows that bits 28, 27, 26 are set.
- Interpreting these as Haswell MSR 0x690 values says these are logs for prior throttling due to hitting Package Power Limit 1, Package Power Limit 2, and Max Turbo Limit.
- Interpreting these as Goldmont 0x64f values says these are logs for prior throttling due to hitting VR Thermal Alert, Max Turbo Limit, and "Electrical Design Point". (Note that these are in a different order)
- Interpreting these as SKX 0x64f values shows the same meanings as Haswell 0x690 for bits 28, 27, 26.
Note that the interpretation by turbostat (line 162) does not indication which MSR number was used (0x690 or 0x64f), and the descriptions of the log bits in that line don't obviously match the documentation for any of the processor models, but I think I need more coffee....
With HWP disabled, I don't know how to determine the minimum frequency ratio that this processor can use. Bits 47:40 of MSR_PLATFORM_INFO (MSR 0xCE, line 133 above) show the "Maximum Efficiency Ratio" is 8, leading to 800 MHz operation. This is typical for "client" cores in the Haswell generation. In later processors, this value is not the lowest frequency ratio that can be used.
The reported processor frequency of 216 to 233 MHz (lines 187-190) is, of course, quite a bit lower than 800, and not particularly close to an integer multiplier of the base 100 MHz clock. This suggests that "duty cycling" (aka "clock modulation") is active. It looks like "hardware duty cycling" is only supported on newer processors, but software clock modulation should be supported on your processor. This is described in section 14.7.3 of Volume 3 of the Intel Architectures SW Developer's Manual. "Clock modulation" limits the processor to being active only 1..15 of each 16 cycles. Several of the mechanisms that are used to determine the clock frequency naturally return the actual clock frequency times the "duty cycle" percentage -- thus allowing frequencies below 800 MHz. I have not done extensive testing, but I seem to recall that some processors apply clock modulation as part of the response to an external signal applied to the PROCHOT pin, but that this mechanism does not necessarily update the corresponding software clock modulation control MSRs. (But you might want to look at them anyway...)
In order to understand what is happening, I would probably use rdmsr to monitor a number of MSRs every second or so while running a "spinner" program bound to a specific core.
- IA32_PKG_THERM_STATUS (MSR 0x1b1) (package scope)
- IA32_THERM_STATUS (MSR 0x19c) (core scope)
- MSR_CORE_PERF_LIMIT_REASONS (using MSR 0x690) (core scope)
- IA32_CLOCK_MODULATION (MSR 0x19a)
- MSR_PKG_ENERGY_STATUS (MSR 0x611) (counts package energy use in units of 1/16384 Joules -- see line 165 above)
- MSR_PKG_PERF_STATUS (MSR 0x613) (counts time throttled due to power limits in units of 1/1024 seconds -- also line 165 above)
If this does not show problems, I would add "spinner" programs on the other cores to try to increase power use and temperature. The most extreme power loading that is easily available is probably the Intel optimized LINPACK benchmark.
- Mark as New
- Bookmark
- Subscribe
- Mute
- Subscribe to RSS Feed
- Permalink
- Report Inappropriate Content
Thank you for the feedback "Dr. Bandwith".
I've updated my "Intel Register Pretty Print" project to include a shell script to get the relevant information, the script is located here:
https://github.com/kzawad1/intel-reg-pp/blob/master/intel-reg-pp/msr_output.sh
Now, I need to wait to catch this happening again. It is hard for me to replicate it, but there is a lot of these these computing devices in the field, so I am hoping it will happen soon.
I've ran across a tool, The Intel BIOS Implementation Test Suite (BITS) (biosbits.org) and decided to run it on one the devices. As it turns out it tells me that there a 3 failures:
- MSR consistency test failure:
- Image
- Text
-
==== MSR consistency test ====
[assert] MSR 0x190 consistent FAIL
  2 unique values
  2 CPUs: 2,3
  MSR 0x198: 0x1d5800001a00
  2 CPUs: 0,1
  MSR 0x198: 0x1d4e00001a00
[assert] MSR 0x637 consistent FAIL
  4 unique values
  1 CPUs: 2
  MSR 0x637: 0xbbe107b4
  1 CPUs: 0
  MSR 0x637: 0xbbe1069c
  1 CPUs: 3
  MSR 0x637: 0xbbe10865
  1 CPUs: 1
  MSR 0x637: 0xbbe1070f
Summary: 8171 passed, 2 failed

Press any key to continue...
-
- Image
- ACPI _PSS (Pstate) runtime tests failure
- Image
- Text
-
==== ACPI Tests ====
---- ACPI _MAT (Multiple APIC Table Entry) under Processor objects ----
Summary: 0 passed, 0 failed
---- ACPI _PSS (Pstate) stable conformance tests ----
[assert] P1: measured frequency 2900 MHz == expected 2500 MHz FAIL
[assert] P2: measured frequency 2900 MHz == expected 2400 MHz FAIL
[assert] P3: measured frequency 2900 MHz == expected 2200 MHz FAIL
[assert] P4: measured frequency 2900 MHz == expected 2100 MHz FAIL
[assert] P5: measured frequency 2900 MHz == expected 1900 MHz FAIL
[assert] P15: measured frequency 800 MHz == expected 775 MHz FAIL
Summary: 11 passed, 6 failed
---- ACPI DSDT (Differentiated System Description Table) ----
Summary: 1 passed, 0 failed
---- ACPI FACP (Fixed ACPI Description Table) ----
Summary: 1 passed, 0 failed
---- ACPI HPET (High Precision Event Timer Table) ----
Summary: 1 passed, 0 failed
---- ACPI MADT (Multiple APIC Descritpion Table) ----
Summary: 1 passed, 0 failed
---- ACPI MPST (Memory Power State Table)
--MORE--
-
- Image
- SMI latency test failure:
- Image
- Text
-
==== SMI latency test ====
Warning: touching the keyboard can affect the results of this test.
Starting test. Wait here, I will be back in 15 seconds.
[assert] SMI latency < 150us to minimize risk of OS timeouts FAIL
  0     < t <=   1us; average = 12ns; count = 1132779477
   Times between first few observations:   40ns   25ns   27ns   23ns   15ns
  100us < t <=   1ms; average =129 us; count = 4
   Times between first few observations:  248us 7826us 8019us
  4 SMI detected using MSR_SMI_COUNT (MSR 0x34)
  Summary of impact: observed maximum latency = 152us
Summary: 0 passed, 1 failed

Press any key to continue...
-
- Image


Would the Intel BIOS BITS test would be useful here in helping determine what could be the problem?
- Mark as New
- Bookmark
- Subscribe
- Mute
- Subscribe to RSS Feed
- Permalink
- Report Inappropriate Content
MSR 0x198 is IA32_PERF_STATUS. The only bits that are documented on most system are bits 15:8, which show 0x1a (ratio = 26 decimal) on all of your cores. This is a perfectly reasonable number for a processor that can Turbo up to 2.9 GHz (ratio=29 decimal). The difference in the high-order bits may or may not mean anything. Some Intel processors use these bits, for example the second generation core processors use bits 47:32 to encode the processor voltage, but this could easily have changed for your processor.
MSR 0x637 is not documented in Volume 4 of the Intel Architectures SW Developer's Manual for any processor, but it does show up in the header files of some open source projects as MSR_COUNTER_24_MHZ, and uses this in reference to Skylake (client) processors. If it is an undocumented counter on your processor, then one would not expect the values to be identical on all cores (since it is not possible to run this with perfect simultaneity).
The ACPI_PSS test shows that you are getting full Turbo performance when the test does not expect it. This may be due to the settings in MSR_TURBO_ACTIVATION_RATIO (0x64c), which was introduced in the "Ivy Bridge" core (3rd generation Core processors). Bits 7:0 of that MSR give a ratio that is interpreted as the maximum non-turbo ratio. It should be set to the nominal frequency ratio (19 decimal on your processor), in which case any frequency requests with ratios larger than 19 are interpreted as requests for maximum frequency. If bit 31 of the register is not set, you can update the register with a different value. If you set bits 7:0 to a value greater than or equal to the maximum Turbo ratio (29 decimal on your processor), then the processor should "obey" frequency requests that are in between 1900 and 2900 MHz. If bit 31 is set, then the BIOS has locked this feature, but this only prevents you from forcing certain specific frequencies, and is not otherwise a problem.
The SMI latency test is clearly not a problem -- there were only 4 System Management Interrupts in 15 seconds, which is a very low rate. The maximum latency of 152 microseconds is only microscopically bigger than the threshold of 150 microseconds, and the average of 129 microseconds is irritating to real-time programmers, but does not indicate any problems.
- Mark as New
- Bookmark
- Subscribe
- Mute
- Subscribe to RSS Feed
- Permalink
- Report Inappropriate Content
Thank you for your response. In this case the Intel BIOS Implementation Test Suite (BITS) would not indicate there is a problem because it is a general tool that covers many processors and different families of processors have different features.
Looking at the "Mobile 4th Generation Intel® Core™ Processor Family, Mobile Intel® Pentium® Processor Family, and Mobile Intel® Celeron® Processor Family Specification Update":
https://www.intel.com/content/dam/www/public/us/en/documents/specification-updates/4th-gen-core-family-mobile-specification-update.pdf
It shows two items below in a table:
HSM55: "TM1 Throttling May Continue Indefinitley ."
HSM51: "Throttling and Refresh Rate Maybe be Incorrect after Exiting Package C-State"
How likely is it that this is happening because of a silicon bug and that I am running into this because of a silicon bug?
For both HSM55 & HSM51 it states "Workaround: It is possible for the BIOS to contain a workaround for this erratum". How do I find out what has to be changed in the BIOS to ensure that workaround for both HSM51 and HSM55 are satisfied?
- Mark as New
- Bookmark
- Subscribe
- Mute
- Subscribe to RSS Feed
- Permalink
- Report Inappropriate Content
Your observations appear to match one or both of these errata. You will have to contact the system vendor to find out if the BIOS workaround has been applied.
- Mark as New
- Bookmark
- Subscribe
- Mute
- Subscribe to RSS Feed
- Permalink
- Report Inappropriate Content
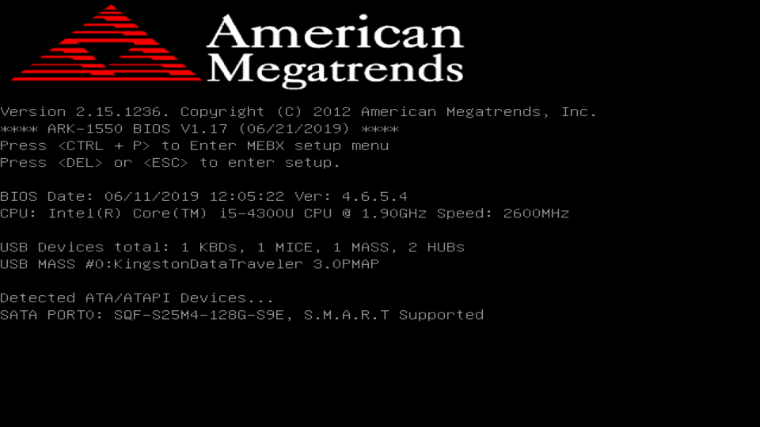
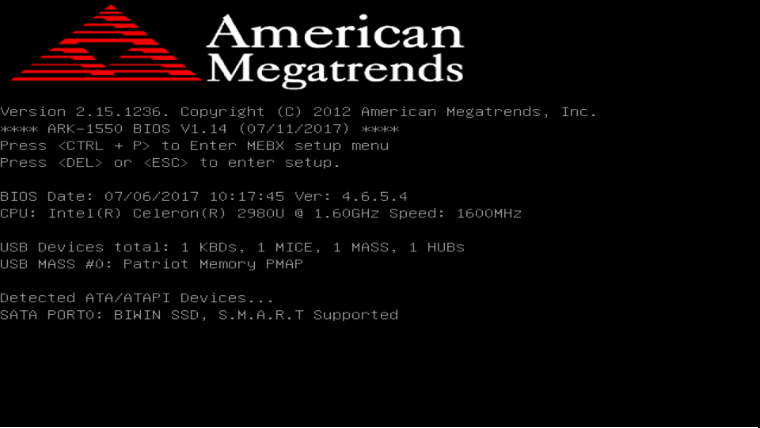
After being persistent about calling and leaving messages, I finally found someone that was able to respond and work with me. This person sent me new BIOS firmware V1.17 to upgrade from V1.14 and I was able to perform the update. Now, the big issue is to figure out what exactly are the changes that they made because for some reason they don't publish the release notes on their website for their Advantech ARK-1550-S9A1E product.
Here are the attachments:
- American Megatrends ARK-1550 BIOS V1.14 Boot Screen
- American Megatrends ARK-1550 BIOS V1.14 BIOS Screen
- American Megatrends ARK-1550 BIOS V1.17 Boot Screen
- American Megatrends ARK-1550 BIOS V1.17 BIOS Screen
Since the work for this is done in Taiwan it takes at least a day to communicate with them because of time zone difference: me -> Advantech Support USA -> Advantech R&D Taiwan -> American Megatrends USA & American Megatrends Taiwan -> Advantech R&D Taiwan -> Advantech Support USA -> me. A lot of back and forth.
I am hoping that there will be someone knowledgeable about the BIOS firmware to be able to give me release notes as well as knowledgeable enough about Intel product line and errata: HSM51 and HSM55 to confirm the errata BIOS workarounds. After that I will post an update.
- Mark as New
- Bookmark
- Subscribe
- Mute
- Subscribe to RSS Feed
- Permalink
- Report Inappropriate Content
Dr. Bandwith,
It took a few weeks, but the issue came back up again. Once again the CPU frequency dips to around ~200 MHz. However, this time "Therm Status" is not set.
I did create a script as you mentioned to read the register values for each individual core, the output is the following:
user1@ubuntu:~$ ./msr_output.sh
MSR Dump, Script Version 1.0

$ eval date
Tue Sep  3 09:43:00 EDT 2019
$ eval cat /proc/cpuinfo | grep "MHz"
cpu MHz		: 232.555
cpu MHz		: 231.915
cpu MHz		: 212.995
cpu MHz		: 213.929
$ eval lsb_release -a
No LSB modules are available.
Distributor ID:	Ubuntu
Description:	Ubuntu 18.04.1 LTS
Release:	18.04
Codename:	bionic
$ eval dmesg | grep 'MHz processor'
[    0.024000] tsc: Detected 2494.194 MHz processor
$ eval cat /sys/devices/system/cpu/cpu*/cpufreq/scaling_governor
performance
performance
performance
performance


+----+------------------------------+---------+----------+----------+----------+----------+
|  # | MSR Register                 | Address |   Core 0 |   Core 1 |   Core 2 |   Core 3 |
+----+------------------------------+---------+----------+----------+----------+----------+
|  0 | IA32_PERF_CTL                |   0x199 |     1d00 |     1d00 |     1d00 |     1d00 |
|  1 | IA32_CLOCK_MODULATION        |   0x19A |        0 |        0 |        0 |        0 |
|  2 | IA32_THERM_INTERRUPT         |   0x19B |       13 |       13 |       13 |       13 |
|  3 | IA32_HWP_THERM_STATUS        |   0x19C | 88480800 | 884b0800 | 88480800 | 884a0800 |
|  4 | IA32_MISC_ENABLE             |   0x1A0 |   850089 |   850089 |   850089 |   850089 |
|  5 | IA32_PACKAGE_THERM_MARGIN    |   0x1A1 |        0 |        0 |        0 |        0 |
|  6 | IA32_TEMPERATURE_TARGET      |   0x1A2 |   640000 |   640000 |   640000 |   640000 |
|  7 | IA32_PKG_THERM_STATUS        |   0x1B1 | 88480800 | 88480800 | 88480800 | 88490800 |
|  8 | MSR_PKG_ENERGY_STATUS        |   0x611 | 524aeba6 | 524b064e | 524b2835 | 524b4583 |
|  9 | MSR_PKG_STATUS               |   0x613 |       50 |       50 |       50 |       50 |
| 10 | MSR_PPERF                    |   0x64E |      N/A |      N/A |      N/A |      N/A |
| 11 | MSR_CORE_PERF_LIMIT_REASONS  |   0x690 | 1c220002 | 1c220002 | 1c220002 | 1c220002 |
| 12 | IA32_PM_ENABLE               |   0x770 |      N/A |      N/A |      N/A |      N/A |
| 13 | IA32_HWP_CAPABILITIES        |   0x771 |      N/A |      N/A |      N/A |      N/A |
| 14 | IA32_HWP_REQUEST_PKG         |   0x772 |      N/A |      N/A |      N/A |      N/A |
| 15 | IA32_HWP_INTERRUPT           |   0x773 |      N/A |      N/A |      N/A |      N/A |
| 16 | IA32_HWP_REQUEST             |   0x774 |      N/A |      N/A |      N/A |      N/A |
| 17 | IA32_HWP_PECI_REQUEST_INFO   |   0x775 |      N/A |      N/A |      N/A |      N/A |
| 18 | IA32_HWP_STATUS              |   0x777 |      N/A |      N/A |      N/A |      N/A |
+----+------------------------------+---------+----------+----------+----------+----------+
Generated table by executing commands:
...


###########################################################################
CORE: 0

...

./intel-reg-pp.out -a 0x19C 88480800

Intel Register Pretty Print (intel-reg-pp) v1.0.0

[19CH] IA32_HWP_THERM_STATUS Register With HWP Feedback
  Command to read: sudo rdmsr 0x19c -f 63:0
Value of register is: 88480800
  64  60        50        40        30        20        10
  43210987654321098765432109876543210987654321098765432109876543210
0b00000000000000000000000000000000010001000010010000000100000000000
  └───────────────┬───────────────┘│└─┬┘└─┬┘└──┬──┘││││││││││││││││
              Reserved             │  │   │    │   ││││││││││││││││
Reading Valid ─────────────────────┘  │   │    │   ││││││││││││││││
Reading in Deg. Celcius ──────────────┘   │    │   ││││││││││││││││
Reserved ─────────────────────────────────┘    │   ││││││││││││││││
Digital Readout ───────────────────────────────┘   ││││││││││││││││ 72 C -> 161 F
Cross-domain Limit Log ────────────────────────────┘│││││││││││││││
Cross-domain Limit Status ──────────────────────────┘││││││││││││││
Current Limit Log ───────────────────────────────────┘│││││││││││││
Current Limit Status ─────────────────────────────────┘││││││││││││
Power Limit Notification Log ──────────────────────────┘│││││││││││
Power Limit Notification Status ────────────────────────┘││││││││││
Thermal Threshold #2 Log ────────────────────────────────┘│││││││││
Thermal Threshold #2 Status ──────────────────────────────┘││││││││
Thermal Threshold #1 Log ──────────────────────────────────┘│││││││
Thermal Threshold #1 Status ────────────────────────────────┘││││││
Critical Temperature Log ────────────────────────────────────┘│││││
Critical Temperature Status ──────────────────────────────────┘││││
PROCHOT# or FORCEPR# Log ──────────────────────────────────────┘│││
PROCHOT# or FORCEPR# Event ─────────────────────────────────────┘││
Thermal Status Log ──────────────────────────────────────────────┘│
Thermal Status ───────────────────────────────────────────────────┘

...
The attached file has each register and core details: Log_output_2019_09_03.txt.
Now, it shows that "Power Limit Notification Log" bit is the only bit set. Would you have any suggestion on determining why the CPU frequency throttling occurred in this case?
- Mark as New
- Bookmark
- Subscribe
- Mute
- Subscribe to RSS Feed
- Permalink
- Report Inappropriate Content
IA32_HWP_THERM_STATUS does not indicate thermal throttling. The 4 cores report temperatures of 28C, 25C, 28C, 26C (remember to subtract each of the "digital readout" values from the thermal throttling temperature in bits 23:16 of IA32_TEMPERATURE_TARGET). The package temperatures from IA32_PKG_THERM_STATUS should all be the same (since that MSR has "package" scope), and they are all either 28C or 27C.
MSR_CORE_PERF_LIMIT_REASONS does indicate trouble:
- Bit 1 is set, indicating that frequency is currently reduced below the operating system request due to a thermal event.
- Bit 17 is the log bit for thermal events, and it will always be set if bit 1 is set.
- Bit 21 is the "Autonomous Utilization-Based Frequency Control log", but the description of the corresponding status bit (bit 5, not currently set) is "When set, frequency is reduced below the operating system request because the processor has detected that utilization is low." I have never found any additional information on this feature.
- Bit 26 (package-level PL1 power limit log) is set, indicating that you hit full power (PL1 is usually set to TDP) at some point since the last reset. Not a problem.
- Bit 27 (package-level PL2 power limit log) is set, indicating that you hit the PL2 power limit at some point since the last reset. I don't think I have ever seen a system hit this power limit before. It is typically ~20% higher than PL1, and is usually configured with a very short maximum time window (1 millisecond). This could indicate a problem?
- Bit 28 (max Turbo limit log) is set, which usually indicates that the max Turbo frequency has been limited because you are using more than (usually 2) cores. I have never seen this on a 4-core part, but I have not looked at very many of those processors.
The most worrisome thing here is bit 1 of MSR_CORE_PERF_LIMIT_REASONS, indicating an active "thermal event". I don't know why this does not show up in IA32_HWP_THERM_STATUS, but I have never been able to understand all the various mechanisms described in Chapter 14 of Volume 3 of the SWDM. I have seen systems for which external throttling events are "sticky", and the throttling does not go away when the throttling signal is cleared. (These were pre-production systems, but bugs can happen.....)
Does the system stay at ~0.2 GHz even when you are running (multi-second) programs? The code used by /proc/cpuinfo does not run long enough to get the cores up to full speed on many systems.....
- Mark as New
- Bookmark
- Subscribe
- Mute
- Subscribe to RSS Feed
- Permalink
- Report Inappropriate Content
For your question regarding "Does the system stay at ~0.2 GHz even when you are running (multi-second) programs?", the answer is yes. I get an automated e-mail, text, & phone call when the event occurs. The first step is to login to the machine using SSH, and right away this is delayed because of the step down from ~2.0 GHZ to ~200 MHz. While at ~200 MHz, I've cloned and started building https://github.com/opcm/pcm and after 1/2 hour of building the software I've manually stopped it because it does not increase the frequency, it stays at ~200 Mhz and a build the would normally take a few minutes takes a very long time. The only way to get it out of the ~200 MHz is to reboot.
I've attached the output of the MSR register values after I rebooted the PC. The file is named: Log_output_2019_09_03_after_reboot.txt. Once rebooted MSR_CORE_PERF_LIMIT_REASONS shows the following bits set:
Electical Design Point Log [CORE 0, CORE 1, CORE 2, CORE 3]
Max Turbo Limit Log [CORE 0, CORE 1, CORE 2, CORE 3]
VR Them Alert Log [CORE 0, CORE 1, CORE 2, CORE 3]
Electrical Design Point Status (R0) [CORE 0, CORE 1, CORE 3]
It is interesting that the "Electrical Design Point Status (R0)" is not set for CORE 2.
You also mentioned /proc/cpuinfo, I find that once rebooted, the output of /proc/cpuinfo seems to be consistently returning values around ~1.9 GHz, with some variation. Please take a look at the attachment: query_proc_cpuinfo.txt. When it scales down to around ~200 MHz, the values returned from /proc/cpuinfo hover around ~200 MHz.
- Mark as New
- Bookmark
- Subscribe
- Mute
- Subscribe to RSS Feed
- Permalink
- Report Inappropriate Content
The "Electrical Design Point" limit is not discussed in much detail in the Intel documentation, but the descriptions in Volume 4 of the SWDM mention exceeding maximum electric current constraints as an example of such a limit. In my experience with Xeon E5 and Xeon Scalable processors, this limit is not easy to hit -- we sometimes see it with the Intel-optimized version of the LINPACK benchmark, but I don't recall ever seeing the status bit set for any other test case. (This one is a bit tricky -- the overhead of switching to kernel mode to read the MSR can reduce the load on the processor enough to clear the "status" bit, though the "log" bit will stay set. That may be what is happening on your CORE 2, since MSR_CORE_PERF_LIMIT_REASONS (0x690) has package scope.)
The VR Therm Alert log is the scary one here. This should not happen in normal operation -- even with very heavy loading. I have never seen this bit set, but when I saw the "Critical Temperature Status" in MSR 0x19c (IA32_THERM_STATUS) (another event that should never happen), it was because the heatsink had been installed without thermal paste. I suppose it is possible that a fanless system like ARK-1550-S9A1E will be more prone to these sorts of over-temperature events. It is a little disconcerting that this occurs shortly after a reboot (presumably before you have had a chance to run any compute-intensive workloads?).
Looking back at the errata document (and actually reading the words this time), it looks like this might be an occurrence of HSM55. If the processor hits the TM1 temperature limit, then the Thermal Control Circuitry (TCC) will activate duty cycle modulation to decrease activity in the processor to (hopefully) allow it to cool. Errata HSM55 says that if the processor drops into Package C3 (or higher-numbered) idle state while the TCC is still active, and the temperature drops below the TM1 limit while the package is still in the Package C3 (or higher-numbered) idle state, then the throttling will not be cancelled when the package "wakes up" to C0 state.
This suggests a way to test the hypothesis that HSM55 is involved -- disable Package C3 state and see if you are still able to trigger the problem. There are a bunch of ways that you might be able to do this:
- BIOS might offer an option to limit the maximum package C-state available. If so, set it to 1.
- Reboot the system with the kernel command-line option "intel_idle.max_cstate=1"
- Write a program that (a) opens the file /dev/cpu_dma_latency, (b) writes a 32-bit integer to the file, (c) leaves the file descriptor open, (d) does not exit! The integer value that you want to write is the maximum core wake-up latency (in microseconds) that you are willing to tolerate. To find what value you want, cat /sys/devices/system/cpu/cpu0/cpuidle/state*/latency and /sys/devices/system/cpu/cpu0/cpuidle/state*/name. You need to pick a numerical value that is smaller than the cpuidle/state*/latency number for any state with a cpuidle/state*/name of C3 or a larger number. In most systems, a value of 10 microseconds will allow the C1 states, but prohibit C3 and higher-numbered states.
- Write a program that runs in the background to ensure that you never have all cores idle. To minimize the performance impact, the program should execute an infinite loop of PAUSE instructions, and it should be launched with the minimum scheduling priority, e.g., "nice -n 19 spinner". It may be convenient to have this program read the TSC, fixed-function performance counters, and some relevant MSRs every few billion PAUSE instructions (which should take about 9 cycles each on a Haswell core) and dump the average frequency, temperature, and other items of interest to a file.
Preventing the cores from going into Core C3 (or higher-numbered) state will prevent the package from going into Package C3 (or higher-numbered) state. This will increase power consumption if the system is typically left idle, but if the system is normally busy then it would not be using Package C-states very much -- so blocking them completely might not make much difference.....
- Mark as New
- Bookmark
- Subscribe
- Mute
- Subscribe to RSS Feed
- Permalink
- Report Inappropriate Content
I am working on Intel Servers with Xeon X5670 CPU. We have a limited BIOS settings of Intel Server Platform. In comparison, I also have IBM HS22 blade servers with the same Xeon X5670 CPU. It has a detailed settings in BIOS for power management for Profile, C-states, P-states, etc. When I do these settings, the IBM HS22 out performs compared to Intel with the same specifications. Can someone please advice me, as to how I can speed up the Intel server for the same performance?
I have tried to do a very detailed comparison between the 2 platforms and have noticed that the Intel platform shows CPU Max Freq in lscpu as 2927.00 MHz, whereas IBM shows 3059.00 MHz. I am not able to figure out Why? I am using CentOS 7.4.
Alternately, when I try i7z utility it shows 3059.00 MHz.
- Subscribe to RSS Feed
- Mark Topic as New
- Mark Topic as Read
- Float this Topic for Current User
- Bookmark
- Subscribe
- Printer Friendly Page