- Mark as New
- Bookmark
- Subscribe
- Mute
- Subscribe to RSS Feed
- Permalink
- Report Inappropriate Content
Hi,
while evaluating impacts the various QPI snoop modes and cluster on die on HPCG, HPL, and Graph500 I came across something odd.
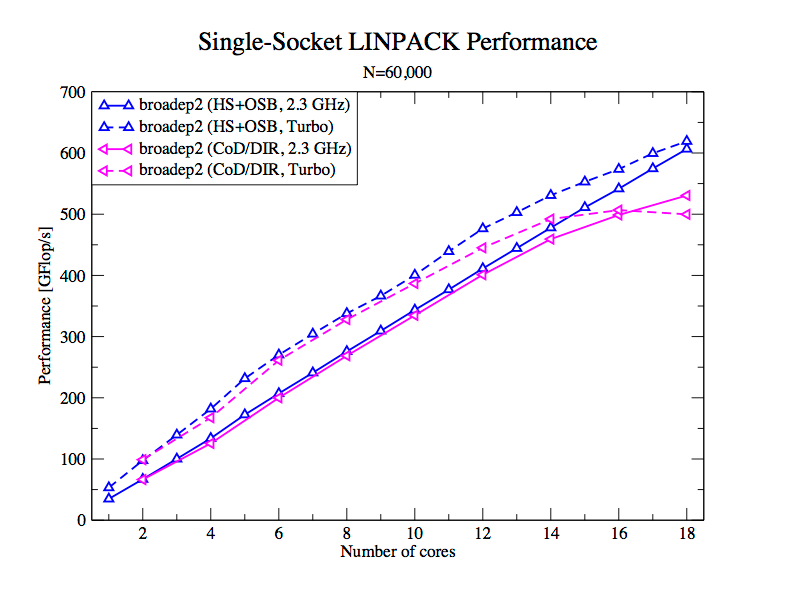
When running LINPACK from MKL on a single Xeon E5-2697 v4 chip, performance with COD enabled is at least 100 GFlop/s lower than in HS+OSB mode (see attached plot). Does anyone have an explanation for this?
I don't think it's a NUMA problem as HPL from MKL does NUMA-aware memory initialization. At least I can see that the total LINPACK memory footprint of roughly 27 GB (60000^2*8B) is distributed evenly (~13GB) per cluster domain. Is inter-ring communication becoming the bottleneck in COD mode? In my opinion, inter-ring communication should be the same, independent of whether COD is used or not. Or is it a shortcoming on the Directory snoop variant used with COD?
Another clue that points to the Uncore as the bottleneck is the fact that in COD, the chip is slower in Turbo mode than when set to 2.3 GHz. The reason for that is that core frequency is apparently given a higher priority than Uncore so while the cores are clocked faster than 2.3 GHz, the Uncore goes as low as 2550MHz vs 2700MHz observed in COD and a fixed CPU frequency of 2.3 GHz. 499 GFlop/s (COD, Turbo) * 2700MHz / 2550 MHz = 530 GFlop/s (COD, CPU fixed at 2.3 GHz).
Link Copied
- Mark as New
- Bookmark
- Subscribe
- Mute
- Subscribe to RSS Feed
- Permalink
- Report Inappropriate Content
I have not tried this particular test case, but for an analogous test on Haswell we found that we needed to provide external NUMA control to get good scaling. Specifically, on a 2-socket Xeon E5-2690v3 box (12 cores/socket), we initially saw poor scaling when going from 12 to 24 threads. It appears that the code initialized all the data on socket 0. Running the test under "numactl --interleave" increased the performance for the 24 thread case up to expected levels. Subsequent tests with memory controller counters confirmed that using 12 cores on a single chip used slightly more than 1/2 of the chip's sustainable memory bandwidth, so it makes sense that scaling would be degraded if the data is all on one chip.
This effect should be more pronounced on a Xeon E5-2697 v4, since you have 33% more cores pulling data and only 12.5% higher peak DRAM bandwidth.
In any case, it is easy to test the workaround.
My Xeon E5-2690 v4 systems should be back online in the next few days and I will be able to get back to testing things like this.
Does anyone know if the source code for the Intel MKL LINPACK test (single-node) is available? I did not see it in the distribution, and it would be convenient if I could re-compile it with inline instrumentation....
- Mark as New
- Bookmark
- Subscribe
- Mute
- Subscribe to RSS Feed
- Permalink
- Report Inappropriate Content
Hello John,
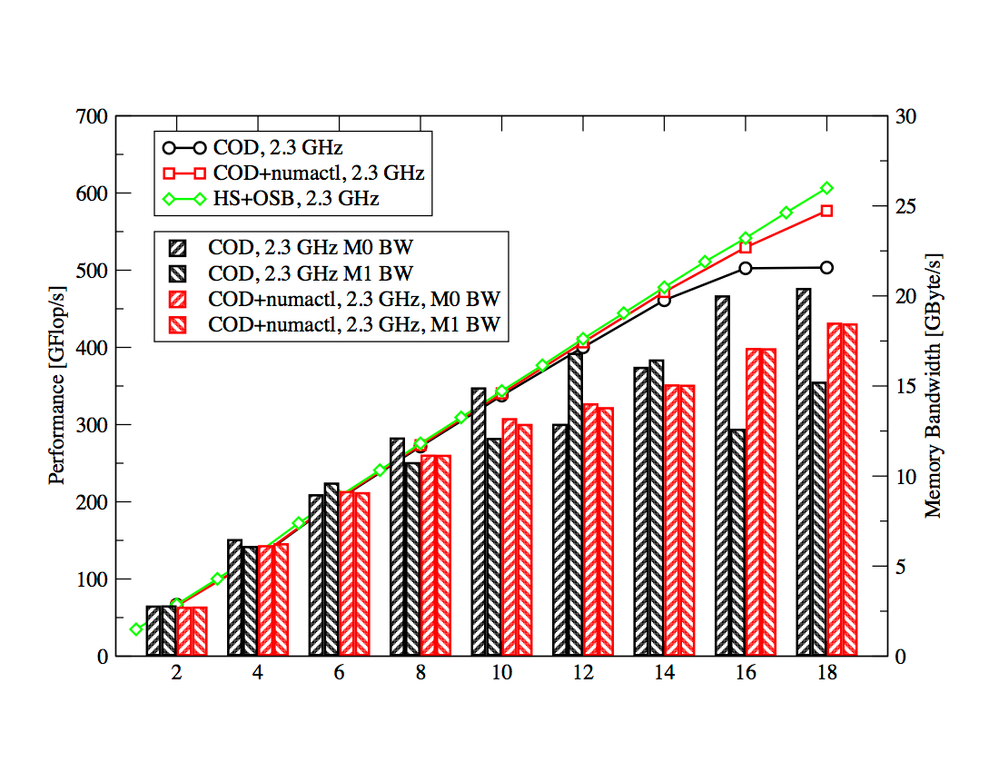
thanks for the pointer. I ran the same benchmark with numactl --interleave=0,1 and, behold, scaling improved (see plot below). It's still not as good as HS+OSB, but almost there. In addition to performance I plotted the memory bandwidth associated with each of the two rings. The results indicate that data is initialised on both cluster nodes, even without numactl. However, the traffic is much less balanced compared to the numactl-enhanced version.
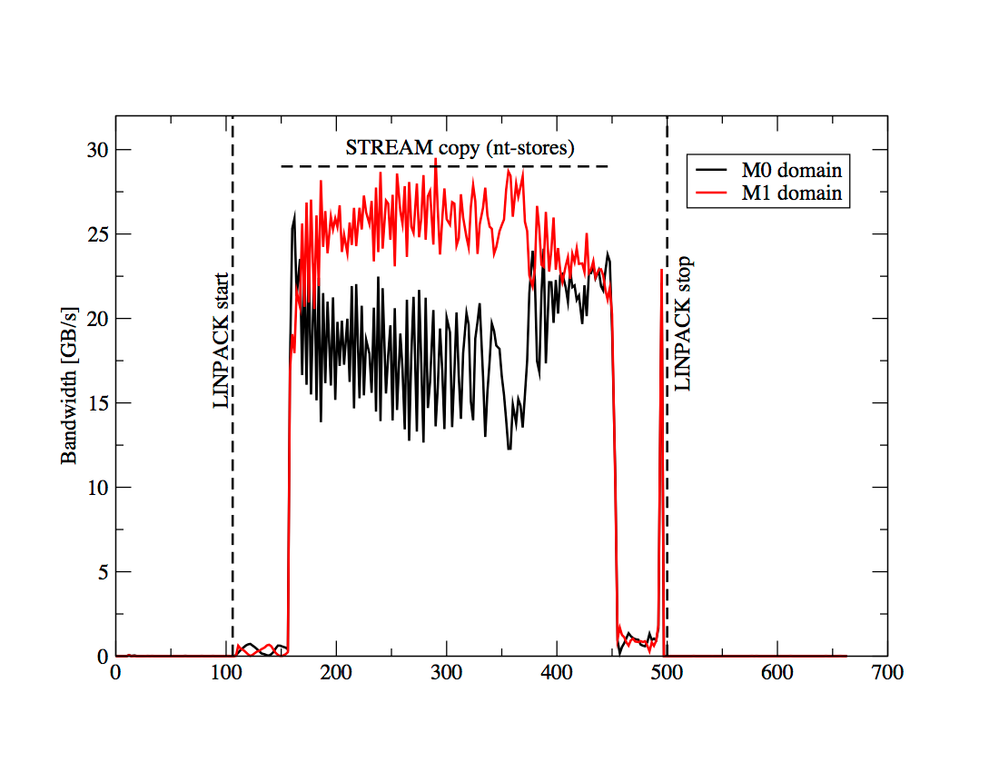
What really irritated me is that I saw no increase in bandwidth when going from 16 to 18 cores in the non-numactl version. I get ~20GB/s from the MC attached to the first physical ring. This hints that LINPACK is memory-bound for high core counts. While 20GB/s is far below the 29 GB/s each MC delivers with 2400MHz memory for a STREAM copy using nt-stores, the results are integrated over time so I couldn't capture actual bandwidths. This is why I re-ran the benchmark for 18 cores and measured events for 1s-windows during HPL execution. This is what I got for the naive, non-interleaved version:
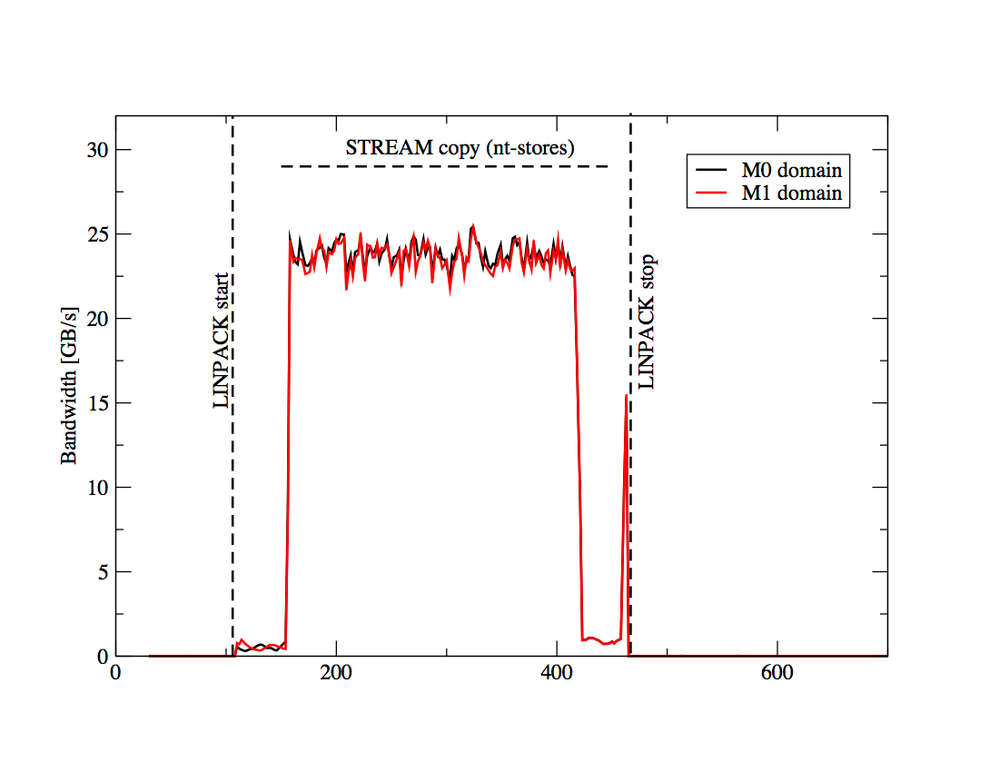
There hardly any bandwidth a "pre" and "post" LINPACK phase, which explains the ~20GB/s measured over the whole run. During the run, we see quite different bandwidths for the different cluster domains. M1 clearly hits the memory bottleneck when numactl isn't used. (Note that this is a different run than in the first plot; the cluster node that gets assigned heavy memory duty without external numa controls appears to vary). Here's the same plot with external numa control:
Homogeneous distribution of bandwidth across cluster domains at speeds well below the memory limit.
- Subscribe to RSS Feed
- Mark Topic as New
- Mark Topic as Read
- Float this Topic for Current User
- Bookmark
- Subscribe
- Printer Friendly Page


