- Mark as New
- Bookmark
- Subscribe
- Mute
- Subscribe to RSS Feed
- Permalink
- Report Inappropriate Content
I have been doing some performance testing with an OpenMP stencil kernel on a dual-socket Broadwell node (22 cores per socket). The kernel applies a 9-point stencil operation to a 2D square matrix.
Performance drops as the matrix size reaches the L3 cache size, which correlates nicely with a jump in the L3 miss rate. But when the grid size reaches about 60% of our main memory size (128GB) we see the performance start to taper off again.
I have been trying to figure out what is causing this taper off with the only clue so far that reservation station stalls (RESOURCE_STALLS:RS) start increasing at the same point.
I understand that RS stalls mean that there are instructions ready to issue but no available reservation station slots to issue to.
The UOPS_EXECUTED_PORT::PORT_0-7 counters remain relatively constant during this transition. There does not seem to be a NUMA locality issue either, as memory access is >99.99% local across the range (using OFFCORE_RESPONSE_0:L3_MISS_LOCAL/L3_MISS_REMOTE). I have also checked the metrics suggested in https://software.intel.com/sites/default/files/article/380498/using-intel-vtune-amplifier-xe-on-xeon-e5-family-1.0.pdf, and not identified any issues. (I don't have the VTune Amplifier - I am collecting the counter data using PAPI and calculating the suggested metrics manually.)
Are there any performance counters that would help me understand why the reservation station is backing up to the point that it is full as the matrix size increases?
Thanks in advance, Mark
- Mark as New
- Bookmark
- Subscribe
- Mute
- Subscribe to RSS Feed
- Permalink
- Report Inappropriate Content
I am assuming that the LLC_MISSES event corresponds to Event 0x2e, Umask 0x41 and the LLC_REFERENCES event corresponds to Event 0x2e, Umask 0x4f. These are "architectural" performance counter events that may be tricky to interpret. I have not tested these on Xeon E5 v4, but on other Intel processors these count Demand Loads (that miss in the L2), Demand Stores (that miss in the L2), but do not count L2 Hardware Prefetches. These definitions make the events useful for counting and/or identifying loads that may incur long latencies, but it also means that they are not useful for determining the total traffic. For simple access patterns like those in the stencil code, it is not uncommon for the majority of the data transfers to be done by L2 Hardware Prefetches, making it more challenging to interpret the implications of demand misses.
To count total traffic from memory to the L3, LLC_MISSES is not enough -- you also need to count L2 Hardware Prefetches that miss in the L3. This can be done with the OFFCORE_RESPONSE event (which should be the same as Xeon E5 v3, described in section 18.11.4.1 of Volume 3 of the Intel Architecture Software Developer's Manual, document 325384). I prefer to use the counters in the memory controllers, but I don't think that these are supported by PAPI. They are supported by the native "perf events" subsystem if you have a new enough kernel. (The kernel is "new enough" if there are directories with names like /sys/bus/event_source/devices/uncore_imc_*/). They should be supported by LIKWID (https://github.com/RRZE-HPC/likwid).
The L2_RQSTS events are probably Event 0x24, and you have specifically requested demand data hits and requests. The L2 Hardware prefetchers may bring data into the L3 or into the L2 and the L3, but this won't effect the access rate from L1 misses. (Note that events like L2_RQSTS.ALL_PF reflect the fact that the L2 Hardware Prefetchers have to check the L2 tag array before sending the request on to the L3, even if they rarely result in L2 hits.)
The L1 Hardware Prefetchers are not documented very clearly, and very few of the performance counters allow you to see L1 Hardware Prefetch requests independently. For Xeon E5 v4, the definition of L2_RQSTS.ALL_DEMAND_DATA_RD says that it includes L1 HW Prefetches, so it appears that you can try to count L1 Hardware Prefetch requests by subtraction:
L2_RQSTS.ALL_DEMAND_DATA_RD - L2_RQSTS.DEMAND_DATA_RD_MISS - L2_REQUESTS.DEMAND_DATA_RD_HIT
Looking at the bit patterns of the Umasks, we can sometimes deduce the meaning of individual bits.
- L2_RQSTS.ALL_DEMAND_DATA_RD = 0xe1 (b1110 0001)
- L2_RQSTS.DEMAND_DATA_RD_MISS = 0x21 (b0010 0001)
- L2_RQSTS.DEMAND_DATA_RD_HIT = 0x41 (b0100 0001)
This suggests that setting the Umask to 0x81 might count L1 HW Prefetch Load requests to the L2.
There is no guarantee that this will work, or that the answers are correct, but it does not usually take a lot of testing to decide whether the results seem plausible or not. Such tests will be easier if you have root access to disable/enable the L1 HW prefetchers, but the L1 HW Prefetchers are (typically) not hard to outsmart with strided or randomized access patterns -- it is just a bit of extra work to test ideas until you find a pattern (or set of patterns) that give an L2 access rate that matches what you think it should be in the absence of L1 HW prefetches.
Was there a point to my rambling?
- You probably want to compare the L3 access rates to what you would expect to see for the stencil operator in the presence of the private L2 caches.
- No re-use is expected in the target array, so every cache line that you store to will miss in the L2 and generate an L3 access.
- In the source array, assume that the offsets in the contiguous direction are provided by the L1 Data Cache.
- Offsets in the non-contiguous direction will come from the L1 for tiny sizes, from the L2 for larger sizes, and from the L3 for larger sizes.
- I am not sure I have done the analysis correctly, but it looks like the source array only needs to be loaded once from any level of cache that holds at least 6 rows (5 reads of the source array plus one write of the target array). For the 256 KiB L2 in Haswell, this is only about 5450 elements.
- If the L2 cache only holds 5 rows, then in addition to loading the leading edge (j+2), you will need to reload the trailing edge (j-2). The leading edge data will come from memory if the two arrays overflow the L3 cache (this will happen at fairly small array sizes), but the trailing edge should still be in the L3 (as long as the thread's share of the L3 is big enough to hold 6 rows).
- The remaining cases are left as an exercise for the reader.
- If the L3 access rates are only a fraction of the expected traffic, you will know that the L2 HW Prefetchers are moving most of the data.
- Additional measurements are needed to determine whether the bandwidth utilization from DRAM is high enough to be a likely performance limiter.
- In this regime, the L3 hit/miss rate of interest is not the demand load hit/miss rate, but the total miss rate (for demand store, demand load, and L2 HW prefetch) compared to the analytical model. The natural units here are "cache lines loaded per iteration" from each level of the memory hierarchy. These are typically divided by the number of cache lines per array to get a measure of cache re-use (or more specifically, lack of cache re-use).
Link Copied
- Mark as New
- Bookmark
- Subscribe
- Mute
- Subscribe to RSS Feed
- Permalink
- Report Inappropriate Content
Running out of Reservation Stations seems unlikely to be the cause of the performance slowdown -- it is more likely an effect due to some other slowdown in execution.
I am just guessing here, but if you are running a standard 2D stencil covering the entire domain, then the slowdown you are seeing is due to the L3 "losing" the previous row of the array before you need it again. You say that the problem starts to occur at a memory footprint of about 128 GiB. If you have two arrays, this is 64 GiB each, or 8 Gi elements each, or just under 93,000 x 93,000. A stencil with a width of +/- 1 will need three rows to fit in the cache to perform an update -- the leading row will be coming in from memory, the current row will be in cache (from the previous iteration) and the trailing row will be in cache (from two iterations ago). This leads to a cache requirement of 93,000 elements/row * 3 rows * 8 Bytes/element = 2.13 MiB. If you are storing the output array using ordinary (i.e., not streaming) stores, then you will have touched an additional 2 rows (1.42 MiB) of output data since you loaded the trailing row. Since you only have 2.5 MiB of L3 per core, I would expect the L3 miss rate to start to increase somewhere before this, but it is easy to imagine that the increased traffic does not result in a noticeable slowdown until somewhere in this size range.
Assuming that your stencil update is not "in-place", streaming/non-temporal stores will help reserve the LLC for the input array. Once you get to to array sizes for which 3 rows of the input array will not fit in the L3 of each core, you may need to perform the updates in blocks to avoid loading the input array more than once. Premature blocking can easily slow things down, but for these giant problem sizes the domains should still be large enough to get excellent vectorization and minimal edge effects.
There are many possible variations. Since this is an OpenMP code on a system with shared L3 cache, you could interleave the row updates across the threads instead of block-distributing them. Then you would not need to find your trailing row in your own share of the L3 -- it could be in the L3 due to other thread's recent activity.
I would guess that blocking in the contiguous dimension is more effective, but that it what experiments are for....
The ultimate in performance comes from a set of techniques called "time skewing" or "space-time tiling" or simple as "wavefront" schemes. In these techniques, multiple iterations of the stencil update are performed concurrently, with the later iterations lagged in space so that their input data is available. An early report that provides fairly easy examples is ftp://ftp.cs.rutgers.edu/cs/pub/technical-reports/work/dcs-tr-378.pdf
- Mark as New
- Bookmark
- Subscribe
- Mute
- Subscribe to RSS Feed
- Permalink
- Report Inappropriate Content
I think I am missing some information....
- How many arrays is the code reading? writing?
- How wide is the stencil? (in the non-contiguous direction)
- Is this single-precision or double-precision?
- Is this being run with huge pages (either explicit or transparent)?
It is often challenging to understand how LRU is going to work for a stencil code with a combination of reads and writes, especially with the various undocumented features that Intel includes in its high-end processors.
With that caveat, it may be useful to note that for double-precision variables, the size of one row matches the L2 size at a dimension of 32768. This is pretty close to where your performance starts falling off. This suggests that an increase in L2 Miss/L3 Hit may be pushing the required L3 bandwidth beyond its capabilities.
- Mark as New
- Bookmark
- Subscribe
- Mute
- Subscribe to RSS Feed
- Permalink
- Report Inappropriate Content
Thanks for your reply.
Increasing L3 cache misses sound feasible but should I see an increase in the miss rate that correlates with the drop in performance?
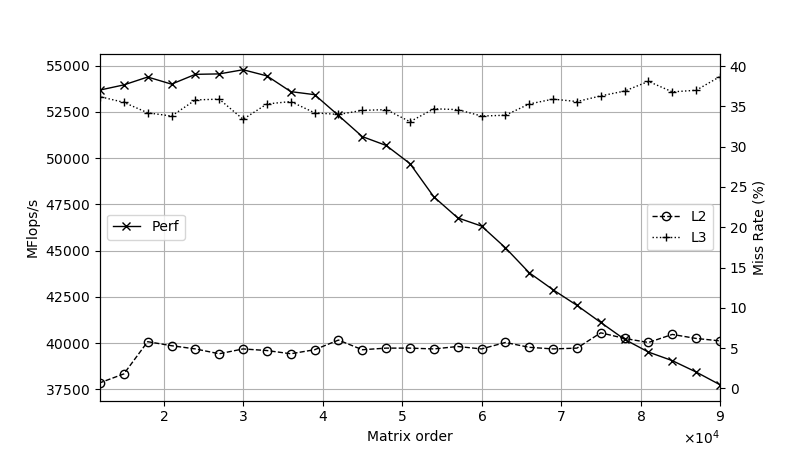
I have attached a couple of plots both at 34 threads/1.4 GHz (the taper off point varies with threads/freq). One shows performance and L3 miss rate, where the L3 miss rate seems to ramp up well after the drop in performance. The other shows stalls/cycle where RS stalls seems to show close correlation with the performance drop off, but I am not sure if this is cause or effect.
I will also do some more experiments with the stencil radius and blocking/tiling and take a look at the time skewing paper, as suggested...
Thanks again, Mark
Update: added L2 miss rate to L3 miss plot
- Mark as New
- Bookmark
- Subscribe
- Mute
- Subscribe to RSS Feed
- Permalink
- Report Inappropriate Content
Please find following info, as requested
- The code reads one input array and writes to one output array (I am using the PRK from https://github.com/ParRes/Kernels/blob/master/OPENMP/Stencil/stencil.c)
- The stencil operates on a square 2D matrix, so matrix size 90k requires 2 arrays of 90k x 90k x 8
- Double-precision
- I have not loaded or linked with the huge pages library
The code is using a star stencil pattern with radius of 2. The stencil has 9 points, as follows
x
x
x x x x x
x
x
I also added an L2 miss rate plot to my previous reply. It shows the L2 miss rate is reasonably steady at around 5%
Regards, Mark
- Mark as New
- Bookmark
- Subscribe
- Mute
- Subscribe to RSS Feed
- Permalink
- Report Inappropriate Content
Which event(s) are you using to compute the L2 and L3 miss rates?
I often find it helpful to disable the HW prefetchers (https://software.intel.com/en-us/articles/disclosure-of-hw-prefetcher-control-on-some-intel-processors) when looking at cache hit/miss rates. With the prefetchers disabled, data is only found in the cache if it was brought in previously by demand loads or stores (and not yet evicted). With the prefetchers enabled, data found in the cache is a confusing combination of data that was referenced previously and data that has been prefetched by the HW.
- Mark as New
- Bookmark
- Subscribe
- Mute
- Subscribe to RSS Feed
- Permalink
- Report Inappropriate Content
I am deriving L3 and L2 miss rates as follows:
- L3 miss rate = LLC_MISSES / LLC_REFERENCES
- L2 miss rate = 1 - L2_RQSTS:DEMAND_DATA_RD_HIT / L2_RQSTS:ALL_DEMAND_DATA_RD
I had a look at msr-tools for disabling the HW prefetchers as suggested, but find it needs root privilege. I will check if there is any option I can use with the system admin team.
I also did some test runs to compare radius of 2 and 4, with the results shown in r2-vs-r4.png attached,
From the performance curves, it seems radius 4 is flat lining on the bottleneck/limit that radius 2 hits at higher matrix order, but increasing threads improves/reduces the bottleneck...?
- Mark as New
- Bookmark
- Subscribe
- Mute
- Subscribe to RSS Feed
- Permalink
- Report Inappropriate Content
I am assuming that the LLC_MISSES event corresponds to Event 0x2e, Umask 0x41 and the LLC_REFERENCES event corresponds to Event 0x2e, Umask 0x4f. These are "architectural" performance counter events that may be tricky to interpret. I have not tested these on Xeon E5 v4, but on other Intel processors these count Demand Loads (that miss in the L2), Demand Stores (that miss in the L2), but do not count L2 Hardware Prefetches. These definitions make the events useful for counting and/or identifying loads that may incur long latencies, but it also means that they are not useful for determining the total traffic. For simple access patterns like those in the stencil code, it is not uncommon for the majority of the data transfers to be done by L2 Hardware Prefetches, making it more challenging to interpret the implications of demand misses.
To count total traffic from memory to the L3, LLC_MISSES is not enough -- you also need to count L2 Hardware Prefetches that miss in the L3. This can be done with the OFFCORE_RESPONSE event (which should be the same as Xeon E5 v3, described in section 18.11.4.1 of Volume 3 of the Intel Architecture Software Developer's Manual, document 325384). I prefer to use the counters in the memory controllers, but I don't think that these are supported by PAPI. They are supported by the native "perf events" subsystem if you have a new enough kernel. (The kernel is "new enough" if there are directories with names like /sys/bus/event_source/devices/uncore_imc_*/). They should be supported by LIKWID (https://github.com/RRZE-HPC/likwid).
The L2_RQSTS events are probably Event 0x24, and you have specifically requested demand data hits and requests. The L2 Hardware prefetchers may bring data into the L3 or into the L2 and the L3, but this won't effect the access rate from L1 misses. (Note that events like L2_RQSTS.ALL_PF reflect the fact that the L2 Hardware Prefetchers have to check the L2 tag array before sending the request on to the L3, even if they rarely result in L2 hits.)
The L1 Hardware Prefetchers are not documented very clearly, and very few of the performance counters allow you to see L1 Hardware Prefetch requests independently. For Xeon E5 v4, the definition of L2_RQSTS.ALL_DEMAND_DATA_RD says that it includes L1 HW Prefetches, so it appears that you can try to count L1 Hardware Prefetch requests by subtraction:
L2_RQSTS.ALL_DEMAND_DATA_RD - L2_RQSTS.DEMAND_DATA_RD_MISS - L2_REQUESTS.DEMAND_DATA_RD_HIT
Looking at the bit patterns of the Umasks, we can sometimes deduce the meaning of individual bits.
- L2_RQSTS.ALL_DEMAND_DATA_RD = 0xe1 (b1110 0001)
- L2_RQSTS.DEMAND_DATA_RD_MISS = 0x21 (b0010 0001)
- L2_RQSTS.DEMAND_DATA_RD_HIT = 0x41 (b0100 0001)
This suggests that setting the Umask to 0x81 might count L1 HW Prefetch Load requests to the L2.
There is no guarantee that this will work, or that the answers are correct, but it does not usually take a lot of testing to decide whether the results seem plausible or not. Such tests will be easier if you have root access to disable/enable the L1 HW prefetchers, but the L1 HW Prefetchers are (typically) not hard to outsmart with strided or randomized access patterns -- it is just a bit of extra work to test ideas until you find a pattern (or set of patterns) that give an L2 access rate that matches what you think it should be in the absence of L1 HW prefetches.
Was there a point to my rambling?
- You probably want to compare the L3 access rates to what you would expect to see for the stencil operator in the presence of the private L2 caches.
- No re-use is expected in the target array, so every cache line that you store to will miss in the L2 and generate an L3 access.
- In the source array, assume that the offsets in the contiguous direction are provided by the L1 Data Cache.
- Offsets in the non-contiguous direction will come from the L1 for tiny sizes, from the L2 for larger sizes, and from the L3 for larger sizes.
- I am not sure I have done the analysis correctly, but it looks like the source array only needs to be loaded once from any level of cache that holds at least 6 rows (5 reads of the source array plus one write of the target array). For the 256 KiB L2 in Haswell, this is only about 5450 elements.
- If the L2 cache only holds 5 rows, then in addition to loading the leading edge (j+2), you will need to reload the trailing edge (j-2). The leading edge data will come from memory if the two arrays overflow the L3 cache (this will happen at fairly small array sizes), but the trailing edge should still be in the L3 (as long as the thread's share of the L3 is big enough to hold 6 rows).
- The remaining cases are left as an exercise for the reader.
- If the L3 access rates are only a fraction of the expected traffic, you will know that the L2 HW Prefetchers are moving most of the data.
- Additional measurements are needed to determine whether the bandwidth utilization from DRAM is high enough to be a likely performance limiter.
- In this regime, the L3 hit/miss rate of interest is not the demand load hit/miss rate, but the total miss rate (for demand store, demand load, and L2 HW prefetch) compared to the analytical model. The natural units here are "cache lines loaded per iteration" from each level of the memory hierarchy. These are typically divided by the number of cache lines per array to get a measure of cache re-use (or more specifically, lack of cache re-use).
- Mark as New
- Bookmark
- Subscribe
- Mute
- Subscribe to RSS Feed
- Permalink
- Report Inappropriate Content
Thanks for the detailed explanation. Our cluster has had a major OS upgrade so there is some higher priority work to sort out the changes. Hopefully I can get back to this problem shortly...
Thanks again, Mark
- Subscribe to RSS Feed
- Mark Topic as New
- Mark Topic as Read
- Float this Topic for Current User
- Bookmark
- Subscribe
- Printer Friendly Page