- Mark as New
- Bookmark
- Subscribe
- Mute
- Subscribe to RSS Feed
- Permalink
- Report Inappropriate Content
Hi,
I am working on Xeon Gold 5215M CPU. And I find the sampling results of perf are not accurate at some time.
I write the C code named 't.c' as below, it use a simple loop to issue some read and write instructions. And I use perf to sampling the mem_inst_retired.all_loads and mem_inst_retired.all_stores events. I then analyzed the sampling results and found them to be very uneven.
#include <stdio.h>
#include <stdint.h>
#include <sys/types.h>
#include <sys/stat.h>
#include <fcntl.h>
#include <unistd.h>
#include <sys/mman.h>
#include <sys/time.h>
#include <string.h>
#include <pthread.h>
#include <errno.h>

#define SZ (4ULL*1024*1024*1024)
#define BUFSZ (8)
static char *path = "/tmp/test";

static void*
runner(void *argv)
{
        int fd;
        register void *base;
        register off_t off = 0;
        register uint64_t val = 8;

        fd = open(path, O_RDWR|O_CREAT, 0660);
        ftruncate(fd, SZ);
        base = mmap((void*)0x7f5300000000, SZ, PROT_READ|PROT_WRITE, MAP_SHARED, fd, 0);

        asm volatile ("nop;");
        asm volatile ("nop;");
        while ((off+BUFSZ<SZ)) {
                val += *(volatile uint64_t *)(base+off);
                val += *(volatile uint64_t *)(base+off);
                val += *(volatile uint64_t *)(base+off);
                /* asm volatile ("mfence"); */
                *(volatile uint64_t *)(base+off)=val;
                *(volatile uint64_t *)(base+off)=val;
                *(volatile uint64_t *)(base+off)=val;
                *(volatile uint64_t *)(base+off)=val;
                *(volatile uint64_t *)(base+off)=val;
                *(volatile uint64_t *)(base+off)=val;
                *(volatile uint64_t *)(base+off)=val;
                *(volatile uint64_t *)(base+off)=val;
                *(volatile uint64_t *)(base+off)=val;
                *(volatile uint64_t *)(base+off)=val;
                *(volatile uint64_t *)(base+off)=val;
                *(volatile uint64_t *)(base+off)=val;
                asm volatile ("mfence");
                *(volatile uint64_t *)(base+off)=val;
                *(volatile uint64_t *)(base+off)=val;
                *(volatile uint64_t *)(base+off)=val;
                *(volatile uint64_t *)(base+off)=val;
                *(volatile uint64_t *)(base+off)=val;
                *(volatile uint64_t *)(base+off)=val;
                *(volatile uint64_t *)(base+off)=val;
                *(volatile uint64_t *)(base+off)=val;
                *(volatile uint64_t *)(base+off)=val;
                *(volatile uint64_t *)(base+off)=val;
                *(volatile uint64_t *)(base+off)=val;
                *(volatile uint64_t *)(base+off)=val;
                off += BUFSZ;
        }
        asm volatile ("nop;");
        asm volatile ("nop;");

        if (fd > 0)
                close(fd);
        return NULL;
}

int
main(void)
{
        pthread_t t1;
        pthread_create(&t1, NULL, runner, NULL);
        pthread_join(t1, NULL);
        return 0;
}
$ gcc -O0 -g -pthread t.c -o t
$ perf record -e mem_inst_retired.all_loads:upp,mem_inst_retired.all_stores:upp -d -c 15913 ./t
$ perf script -F ip > t.res
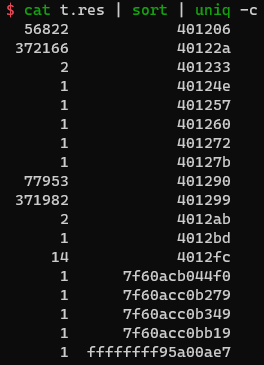
$ cat t.res | sort | uniq -c
where 401206 is the first read instruction at line 32, 40122a is the first write instruction at line 36, 401290 is the mfence at line 48, 401299 is the write instruction just after the mfence at line 49.
May I kindly ask, do these events use PEBS? And why the distribution is so uneven? How to explain this phenomenon? Skid doesn't seem to be able to explain this phenomenon very well. If it uses PEBS, can the shadow effect explain this phenomenon?
Thanks
Jifei
Link Copied
- Mark as New
- Bookmark
- Subscribe
- Mute
- Subscribe to RSS Feed
- Permalink
- Report Inappropriate Content
You may try to use a perf stat which employs a precise counting mode, beside that you may add a triple-p (ppp) argument to force the highest level of skid reduction.
By my own observation adding the "ppp" option did not reduce much the shadowing effect. I used that option in conjunction with an event "INSTR_RETIRED.PREC_DIST".
I did not observe the effect described in this link
https://lore.kernel.org/patchwork/patch/608061/
For exact information about the PEBS events you may consult this document
- Mark as New
- Bookmark
- Subscribe
- Mute
- Subscribe to RSS Feed
- Permalink
- Report Inappropriate Content
I don't think Intel has ever said that PEBS gives evenly distributed samples. Actually, it's well known that PEBS samples tend to have a biased distribution (such as toward high latency instructions). That's why INST_RETIRED.PREC_DIST exists.
- Mark as New
- Bookmark
- Subscribe
- Mute
- Subscribe to RSS Feed
- Permalink
- Report Inappropriate Content
In my investigation INST_RETIRED.PREC_DIST did not provide an exact distribution of machine code instruction contribution.
The precision was 1/12 (not assuming macro-op fusion), that mean out of 12 machine code instructions executed in tight loop only one of them was recognized and marked as 100% sample contributor.
Here is my post
- Subscribe to RSS Feed
- Mark Topic as New
- Mark Topic as Read
- Float this Topic for Current User
- Bookmark
- Subscribe
- Printer Friendly Page
