- Mark as New
- Bookmark
- Subscribe
- Mute
- Subscribe to RSS Feed
- Permalink
- Report Inappropriate Content
Hello all,
We've got very strange behavior when testing IP packet forwarding performance on Sandy Bridge platform (Supermicro X9DRH with the latest BIOS) on Linux Kernel. This is two socket E5-2690 CPU system. Using different PC we're generating DDoS-like traffic with rate of about 4.5 million packets per second. Traffic is receiving by two Intel 82599 NICs and forwarding using the second port of one of this NICs. All load is evenly distributed among two nodes, so each of 32 CPUs SI usage is virtually equal.
Now the strangest part. Few moments after pktgen start on traffic generator PC, average CPU usage on SB system goes to 30-35%. No packet drops, no rx_missed_errors, no rx_no_dma_resources. Very nice. But CPU usage starts to decreasing gradually. After about 10 seconds we see ~15% average among all CPUs. Still no packet drops, the same RX rate as in the beginning, RX packet count is equal to TX packet count. After some time we see that average usage start to go up. Peaked at initial 30-35% it goes down to 15% again. This pattern is repeated every 80 seconds. Interval is very stable. It is undoubtedly bind to the test start time, because if we start test, then interrupt it after 10 seconds and start it again we see the same 30% CPU peak in a few moments. Then all timings will be the same.
During the high load time we see this in "perf top -e cache-misses":
14017.00 24.9% __netdev_alloc_skb [kernel.kallsyms]
5172.00 9.2% _raw_spin_lock [kernel.kallsyms]
4722.00 8.4% build_skb [kernel.kallsyms]
3603.00 6.4% fib_table_lookup [kernel.kallsyms]
During the "15% load time" top is different:
11090.00 20.9% build_skb [kernel.kallsyms]
4879.00 9.2% fib_table_lookup [kernel.kallsyms]
4756.00 9.0% ipt_do_table /lib/modules/3.12.15-BUIL
3042.00 5.7% nf_iterate [kernel.kallsyms]
And __netdev_alloc_skb is at the end of list:
911.00 0.5% __netdev_alloc_skb [kernel.kallsyms]
Some info from "perf stat -a sleep 2":
15% CPU case:
28640006291 cycles # 0.447 GHz [83.23%]
38764605205 instructions # 1.35 insns per cycle
30% CPU case:
56225552442 cycles # 0.877 GHz [83.23%]
39718182298 instructions # 0.71 insns per cycle
Cycles go up, but instructions remain the same.
CPUs never go above C1 state, all cores speed from /proc/cpuinfo is constant at 2899.942 MHz. ASPM is disabled.
All non-essential userspace apps was explicitly killed for test time, there was no active cron jobs too. So we should assume no interference with userspace.
Kernel version is 3.12.15 (ixgbe 3.21.2), but we have the same behavior with ancient 2.6.35 (ixgbe 3.10.16). Although on 2.6.35 we sometimes get 160-170 seconds interval and different symbols at the "perf top" output (especially cheap local_bh_enable() which is completely blows my mind).
So now I think that the problem has nothing with software, but with some part or hardware. Does anybody have some thoughts about the reasons of this kind of behavior? Sandy Bridge CPU has many uncore and offcore events, which I can sample, maybe some of them can shed some light on such behavior?
Thank you!
Link Copied
- Mark as New
- Bookmark
- Subscribe
- Mute
- Subscribe to RSS Feed
- Permalink
- Report Inappropriate Content
As I was able to understand your measurement has sin wave like pattern despite the same load being generated?One question arises here does every packet has the same TCP payload content?
- Mark as New
- Bookmark
- Subscribe
- Mute
- Subscribe to RSS Feed
- Permalink
- Report Inappropriate Content
Each packet is Linux pktgen generated UDP packet with length of 64 byte. All packets send from random source IP address to random destination. This traffic is just go through Sandy Bridge box without any content analysis.
http://www.wireshark.org/docs/dfref/p/pktgen.html
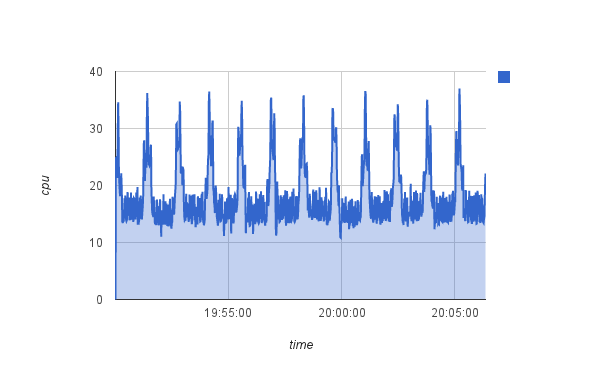
Here is the graph for CPU load. Just don't understand what is the cause of this spikes.
- Mark as New
- Bookmark
- Subscribe
- Mute
- Subscribe to RSS Feed
- Permalink
- Report Inappropriate Content
- Mark as New
- Bookmark
- Subscribe
- Mute
- Subscribe to RSS Feed
- Permalink
- Report Inappropriate Content
Maybe you are seeing accumulated interrupt processing time(I mean Interrupt Service Routine) which contribute to those spikes and also some part of the CPU time is spend trying to allocate memory buffers by using *__alloc_skb() function.I can also see that this function tries to allocate memory on some NUMA node.By further theorizing those spikes are related to buffer allocations when incoming packets are buffered and sent to the CPU.
- Mark as New
- Bookmark
- Subscribe
- Mute
- Subscribe to RSS Feed
- Permalink
- Report Inappropriate Content
- Mark as New
- Bookmark
- Subscribe
- Mute
- Subscribe to RSS Feed
- Permalink
- Report Inappropriate Content
Can you obtain the source of those interrupts?I can further theorize that you are seeing some kind of interrupt coalescing.Moreover the periodicity of those spikes can indicate aferomentioned coalescing.I suppose that NIC will not interrupt CPU per single packet base.NIC will simply buffer probably in internal on chip memory buffers incoming Ethernet frames do some processing on them(extracting higher level protocols etc...) and when the buffer(s) will be full it will signal the CPU by firing up the interrupt.
- Mark as New
- Bookmark
- Subscribe
- Mute
- Subscribe to RSS Feed
- Permalink
- Report Inappropriate Content
>>>This spikes is relatively long - about 20 seconds if I count from its beginning to the end and very constant in its timing (you can see this from graph in attachment).>>>
Yes I see it.I think that you are seeing superposition? (I do not know if this is a proper word) of many short time interrupt signals.
- Mark as New
- Bookmark
- Subscribe
- Mute
- Subscribe to RSS Feed
- Permalink
- Report Inappropriate Content
- Mark as New
- Bookmark
- Subscribe
- Mute
- Subscribe to RSS Feed
- Permalink
- Report Inappropriate Content
Number of packets could be changing over the time hence the count of interrupts also.Beside the NIC interrupts you could have also I/O interrupts.By looking at the screenshot can you provide the exact breakdown of the CPU load?
- Mark as New
- Bookmark
- Subscribe
- Mute
- Subscribe to RSS Feed
- Permalink
- Report Inappropriate Content
- Mark as New
- Bookmark
- Subscribe
- Mute
- Subscribe to RSS Feed
- Permalink
- Report Inappropriate Content
I would suggest you to do profiling with the VTune and post the result.
- Mark as New
- Bookmark
- Subscribe
- Mute
- Subscribe to RSS Feed
- Permalink
- Report Inappropriate Content
You told that 82599 will not send interrupt to the CPU for each packet instead it will send when its bucket will be full with the packets. I can see this may degrade the performance of a NIC. please suggest any reference guide for interrupt coalescing.
Thanks,
Himanshu
- Mark as New
- Bookmark
- Subscribe
- Mute
- Subscribe to RSS Feed
- Permalink
- Report Inappropriate Content
Himanshu T. wrote:
You told that 82599 will not send interrupt to the CPU for each packet instead it will send when its bucket will be full with the packets. I can see this may degrade the performance of a NIC. please suggest any reference guide for interrupt coalescing.
Thanks,
Himanshu
Do you mean debugging guide?
- Mark as New
- Bookmark
- Subscribe
- Mute
- Subscribe to RSS Feed
- Permalink
- Report Inappropriate Content
@Himanshu,
Are you using Windows or Linux?
- Subscribe to RSS Feed
- Mark Topic as New
- Mark Topic as Read
- Float this Topic for Current User
- Bookmark
- Subscribe
- Printer Friendly Page