- Mark as New
- Bookmark
- Subscribe
- Mute
- Subscribe to RSS Feed
- Permalink
- Report Inappropriate Content
1 Solution
- Mark as New
- Bookmark
- Subscribe
- Mute
- Subscribe to RSS Feed
- Permalink
- Report Inappropriate Content
Hi Lin Wang,
the uncore PMU is not supported in perf in your Linux kernel. You need to try Linux kernel 3.5.
Thanks,
Roman
Link Copied
13 Replies
- Mark as New
- Bookmark
- Subscribe
- Mute
- Subscribe to RSS Feed
- Permalink
- Report Inappropriate Content
Hi Lin Wang,
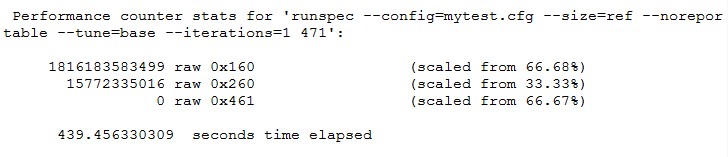
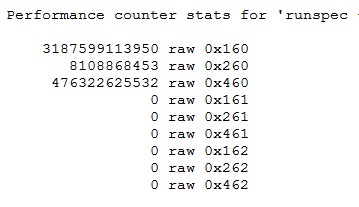
on the screen shot I see that only the count for raw event 0x461 is zero. Event 0x461 is UNC_DRAM_PAGE_CLOSE.CH2 and not UNC_DRAM_PAGE_CLOSE.CH0. Instead you have to use event 0x161 to monitor UNC_DRAM_PAGE_CLOSE.CH0.
Best regards,
Roman
- Mark as New
- Bookmark
- Subscribe
- Mute
- Subscribe to RSS Feed
- Permalink
- Report Inappropriate Content
- Mark as New
- Bookmark
- Subscribe
- Mute
- Subscribe to RSS Feed
- Permalink
- Report Inappropriate Content
I had no trouble reading these events on my Intel Xeon X5680 using utilities from msrtools-1.2 to read and write the uncore performance monitor MSRs. I did not think that "perf" had any provisions for accessing the MSR-based uncore counters?
- Mark as New
- Bookmark
- Subscribe
- Mute
- Subscribe to RSS Feed
- Permalink
- Report Inappropriate Content
Hi Lin Wang,
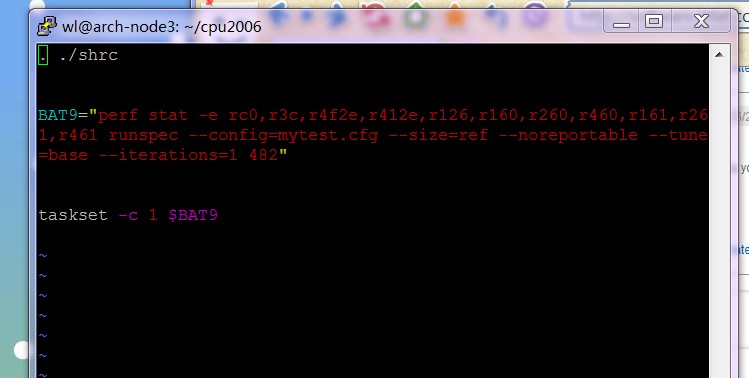
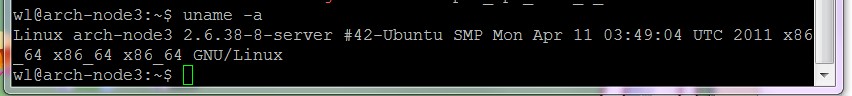
what is the version of Linux kernel are you using? Could you post the complete command line for perf that you are using with the raw events ?
Best regards,
Roman
- Mark as New
- Bookmark
- Subscribe
- Mute
- Subscribe to RSS Feed
- Permalink
- Report Inappropriate Content
- Mark as New
- Bookmark
- Subscribe
- Mute
- Subscribe to RSS Feed
- Permalink
- Report Inappropriate Content
- Mark as New
- Bookmark
- Subscribe
- Mute
- Subscribe to RSS Feed
- Permalink
- Report Inappropriate Content
Hi Lin Wang,
the -e rXXX format is to collect statistics for *on-core* raw PMU events.But you would like to monitor events from *uncore* PMU. I need to check on the status of perf uncore support in Linux. There was a recent development in that direction. In the meantime, could you send the Linux kernel version you are using ("uname -a" command).
Roman
- Mark as New
- Bookmark
- Subscribe
- Mute
- Subscribe to RSS Feed
- Permalink
- Report Inappropriate Content
The initial support for Xeon E5620 (and other processors with microarchitecture codenamed Nehalem-EP, Westmere-EP and SandyBridge-EP) uncore events is included into the Linux kernel mainline starting from version 3.5
- Mark as New
- Bookmark
- Subscribe
- Mute
- Subscribe to RSS Feed
- Permalink
- Report Inappropriate Content
- Mark as New
- Bookmark
- Subscribe
- Mute
- Subscribe to RSS Feed
- Permalink
- Report Inappropriate Content
Hi Lin Wang,
the uncore PMU is not supported in perf in your Linux kernel. You need to try Linux kernel 3.5.
Thanks,
Roman
- Mark as New
- Bookmark
- Subscribe
- Mute
- Subscribe to RSS Feed
- Permalink
- Report Inappropriate Content
hello, Roman,
where are you find information about the support linux version, can you give me the link or document. I want learn more. Thank you.
best regards,
lin wang
- Mark as New
- Bookmark
- Subscribe
- Mute
- Subscribe to RSS Feed
- Permalink
- Report Inappropriate Content
- Mark as New
- Bookmark
- Subscribe
- Mute
- Subscribe to RSS Feed
- Permalink
- Report Inappropriate Content
I have installed linux-tools-3.5 for profiling,but I can't get uncore PMU now, I will try linux-tools-3.6 the next few days.
Reply
Topic Options
- Subscribe to RSS Feed
- Mark Topic as New
- Mark Topic as Read
- Float this Topic for Current User
- Bookmark
- Subscribe
- Printer Friendly Page