- Mark as New
- Bookmark
- Subscribe
- Mute
- Subscribe to RSS Feed
- Permalink
- Report Inappropriate Content
Hi,
With PCM, we can monitor channel read and writes. But It it possible to
identify and report the DIMM's corresponding to the channel being accessed in the read/writes.
Link Copied
- Mark as New
- Bookmark
- Subscribe
- Mute
- Subscribe to RSS Feed
- Permalink
- Report Inappropriate Content
Hello Saptarshi,
No, it is not possible with PCM currently. Depending on your chip, you might be able to find a 'which DIMM is getting used' event. I don't know which chip might support this... i would have to dig through the manuals like you. But it would be your responsibility to program the event or find/use a tool which supports the event.
Sorry,
Pat
- Mark as New
- Bookmark
- Subscribe
- Mute
- Subscribe to RSS Feed
- Permalink
- Report Inappropriate Content
I have never run across a system that allows filtering event counts based on DRAM rank within a channel.
The closest I have ever seen is on the AMD Opteron processors. They don't allow counting how many accesses go to each rank, but they do allow counting DRAM channel stall cycles incurred due to rank-to-rank read switching. The memory controller will reorder accesses (within constraints of buffer sizes and access ordering) to minimize these stalls, but counting such stalls is one reason why knowing the rank number being accessed might be useful.
Given sufficient patience, one can map virtual to physical addresses and then dig through the (often challenging) documentation to determine how physical addresses are mapped to DRAM channel/rank/bank/column. I think that the control register descriptions are available in the product datasheets -- for example the data for my Xeon E5-2680 processors appears to be in Intel's document 326509-003 "Intel Xeon Processor E5-1600/2600/4600 (E5-Product Family) Product Families, Datasheet -- Volume 2", May 2012. Documentation at this level is not easy to understand and typically requires a great deal of analysis to be useful.
Unfortunately, even knowing the physical address and the mapping to DRAM channel/bank/rank does not help with the problem of which loads or stores actually miss in all the caches and make it all the way to DRAM. In most cases very few loads or stores get all the way to DRAM -- most of the DRAM accesses are hardware prefetches and these mechanisms are not described in enough detail to easily determine what addresses are prefetched in any given interval.
Given the typical interleave choices made in x86 systems, combined with the randomization of physical address bits by current operating systems, one would expect that each 4 KiB page would have an approximately equal chance of being mapped to any of the ranks in the system. (The 4 KiB page would typically be mapped to the same rank in all DRAM channels, since channel interleaving on cache-line granularity is the most common configuration.) Individual cases will vary, but both the hardware and the software make this mapping extremely difficult to observe and even harder to control.
If you are burdened with an excessive supply of money, a web search for "ddr3 dram logic analyzer" will lead you to the sorts of products that are used by processor, motherboard, and memory design companies to obtain the detailed DRAM bus transaction records. Prices start at about $15,000 USD on eBay for used logic analyzers of the type commonly used in this application. In addition to the logic analyzer, a full-speed DDR3 DIMM interposer would be required, but I don't have any guesses on cost for those....
- Mark as New
- Bookmark
- Subscribe
- Mute
- Subscribe to RSS Feed
- Permalink
- Report Inappropriate Content
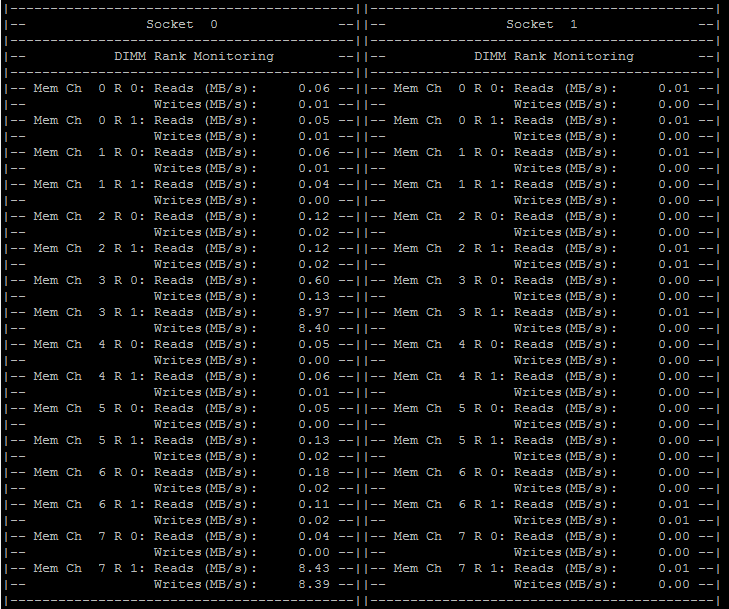
Intel Xeon E5 v2 (Ivybridge-EP), Intel Xeon E5 v3 (Haswell-EP), Intel Xeon E7 v2 (Ivybridge-EX), Intel Xeon E7 v3 (Haswell-EX), Intel Xeon D-1500 (Broadwell-DE) series support DIMM rank monitoring as described in the documentation referenced here. The events of interest are "RD_CAS_RANK*" and "WR_CAS_RANK*".
In the latest Intel PCM 2.9 you can the specify two ranks of interest (out of 8) to monitor. Here are example command line options to monitor traffic on DIMM ranks 0 and 1:
pcm-memory.x -rank=0 -rank=1

best regards,
Roman
- Subscribe to RSS Feed
- Mark Topic as New
- Mark Topic as Read
- Float this Topic for Current User
- Bookmark
- Subscribe
- Printer Friendly Page
