- Mark as New
- Bookmark
- Subscribe
- Mute
- Subscribe to RSS Feed
- Permalink
- Report Inappropriate Content
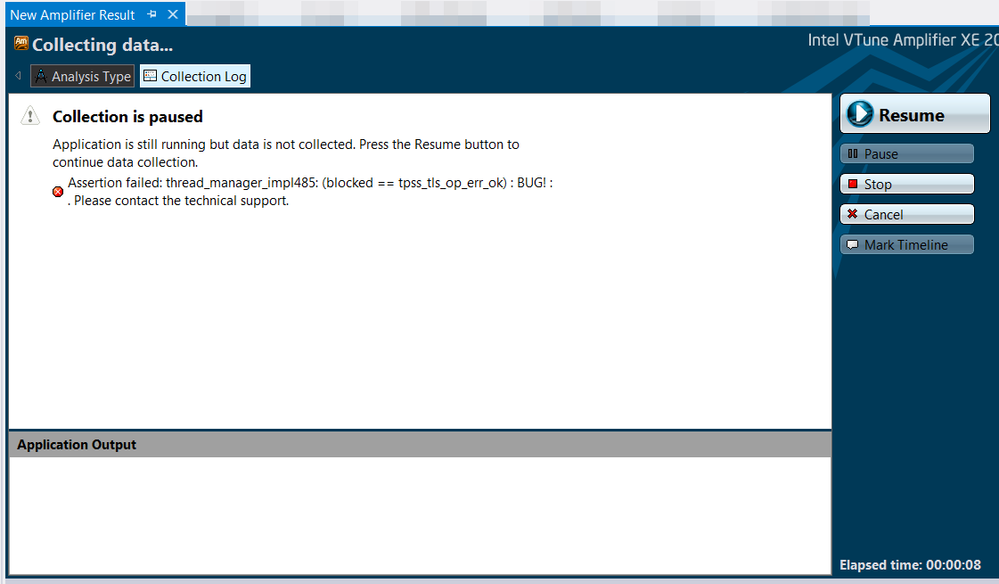
Amplifier hangs on application start. See screenshot.
It is at the very beginning of SolidWorks 2015 application start.
I tested all kind of analysis (hotspots, adv hotspots, locks & waits).
I use update 17.
Any ideas?
Link Copied
- « Previous
-
- 1
- 2
- Next »
- Mark as New
- Bookmark
- Subscribe
- Mute
- Subscribe to RSS Feed
- Permalink
- Report Inappropriate Content
@Maxim
Can you check all sldsearchu.dll dependencies?
>>>search of sldsearchu.dll gives 0 handles>>>
Are you in the proper context (SolidWorks) process.
- Mark as New
- Bookmark
- Subscribe
- Mute
- Subscribe to RSS Feed
- Permalink
- Report Inappropriate Content
iliyapolak wrote:
@Maxim
Can you check all sldsearchu.dll dependencies?
>>>search of sldsearchu.dll gives 0 handles>>>
Are you in the proper context (SolidWorks) process.
I used ProcessExplorer and searched all processes for sldsearchu.dll handle
- Mark as New
- Bookmark
- Subscribe
- Mute
- Subscribe to RSS Feed
- Permalink
- Report Inappropriate Content
iliyapolak wrote:
>>>So, following iliyapolak's train of thought most recently, I think the easiest might be to get the "handle" utility from sysinternals and see who might have an open handle to the DLL. Run the utility while the Solid Works modal dialog is still open and waiting for you to click "ok" That might give a clue as to who is holding on to it (Visual Studio maybe). And, it would also tell you whether or not that is why it can't be loaded>>>
Very good approach. There is another slightly more advanced method for DLL loading failure. It is based on Windows debugger and its option to track DLL's loading proces with the help of loader snaps settings.
http://msdn.microsoft.com/en-us/library/windows/hardware/ff556886(v=vs.85).aspx
http://blogs.msdn.com/b/junfeng/archive/2006/11/20/debugging-loadlibrary-failures.aspx
I'm new for this tool. I tried it (enabled sls for SOLIDWORKS.exe) and it showed a lot of info in debug window, when I ran under MSVC debugger. But SolidWorks works fine under MSVC debugger.
But I see no such log when I run under VTune. Where can I see this load-dll log file?
- Mark as New
- Bookmark
- Subscribe
- Mute
- Subscribe to RSS Feed
- Permalink
- Report Inappropriate Content
Also I tried stand-alone Amplifier GUI and SolidWorks fails the same way... So this problem doesn't related to MSVS
- Mark as New
- Bookmark
- Subscribe
- Mute
- Subscribe to RSS Feed
- Permalink
- Report Inappropriate Content
+1 for loader snaps, since handle isn't giving any data. I suggest to focus on the stand alone scenario for the loader snaps as the next step.
You should be able to use the gflags Image File tab to set both loader snaps and debugger for the solid works exe. When you do that, when you run vtune standalone scenario, the debugger will launch. I think the lightest weight debugger is still cdb.exe from the platform SDK, but windbg worked just fine for me.
You can send startup commands in gflags, such as -g and -c "command string". I tried a few things and this is what worked for me in the debugger field of gflags for the image file chrome.exe. However, I had to configure chrome to run as an administrator, in order to get the log file to open without error. Just FYI if you have trouble with the log file.
c:\debuggers(intel64)\windbg.exe -c ".logopen c:\snaps.log" -g
Regarding Peter's questions: I would like to see the difference between the two environments when you launch stand-alone versus attach. If solid-works deploys their dll's local to the application directory tree or some other share location that requires a load path. Is it possible that environment is not set properly when you launch from vtune? Seems a simple thing that you might want to check first because loader-snaps can be cumbersome as mentioned in the blog iliyapolak posted. Only thing I can think of that hasn't been checked yet. However, if you are not really sure about that, loader snaps will pick it up anyway.
- Mark as New
- Bookmark
- Subscribe
- Mute
- Subscribe to RSS Feed
- Permalink
- Report Inappropriate Content
Maxim Popov wrote:
Also I tried stand-alone Amplifier GUI and SolidWorks fails the same way... So this problem doesn't related to MSVS
Before digging deep into loading proces internals with the help of Windbg try to use Dependency Walker LoadLibrary interception.
- Mark as New
- Bookmark
- Subscribe
- Mute
- Subscribe to RSS Feed
- Permalink
- Report Inappropriate Content
Bob L. HUD (Intel) wrote:
+1 for loader snaps, since handle isn't giving any data. I suggest to focus on the stand alone scenario for the loader snaps as the next step.
You should be able to use the gflags Image File tab to set both loader snaps and debugger for the solid works exe. When you do that, when you run vtune standalone scenario, the debugger will launch. I think the lightest weight debugger is still cdb.exe from the platform SDK, but windbg worked just fine for me.
You can send startup commands in gflags, such as -g and -c "command string". I tried a few things and this is what worked for me in the debugger field of gflags for the image file chrome.exe. However, I had to configure chrome to run as an administrator, in order to get the log file to open without error. Just FYI if you have trouble with the log file.
c:\debuggers(intel64)\windbg.exe -c ".logopen c:\snaps.log" -g
Regarding Peter's questions: I would like to see the difference between the two environments when you launch stand-alone versus attach. If solid-works deploys their dll's local to the application directory tree or some other share location that requires a load path. Is it possible that environment is not set properly when you launch from vtune? Seems a simple thing that you might want to check first because loader-snaps can be cumbersome as mentioned in the blog iliyapolak posted. Only thing I can think of that hasn't been checked yet. However, if you are not really sure about that, loader snaps will pick it up anyway.
My compliments on your informative post.
- Mark as New
- Bookmark
- Subscribe
- Mute
- Subscribe to RSS Feed
- Permalink
- Report Inappropriate Content
- Mark as New
- Bookmark
- Subscribe
- Mute
- Subscribe to RSS Feed
- Permalink
- Report Inappropriate Content
>>>Also I tried stand-alone Amplifier GUI and SolidWorks fails the same way... So this problem doesn't related to MSVS>>>
LoadLibrary() and LoadLibraryEx() on failure wil return error code which further can be deciphered by calling GetLastError. That information can be helpful during debugging.
@Maxim
What is the path to sldsearchu.dll ?
- Mark as New
- Bookmark
- Subscribe
- Mute
- Subscribe to RSS Feed
- Permalink
- Report Inappropriate Content
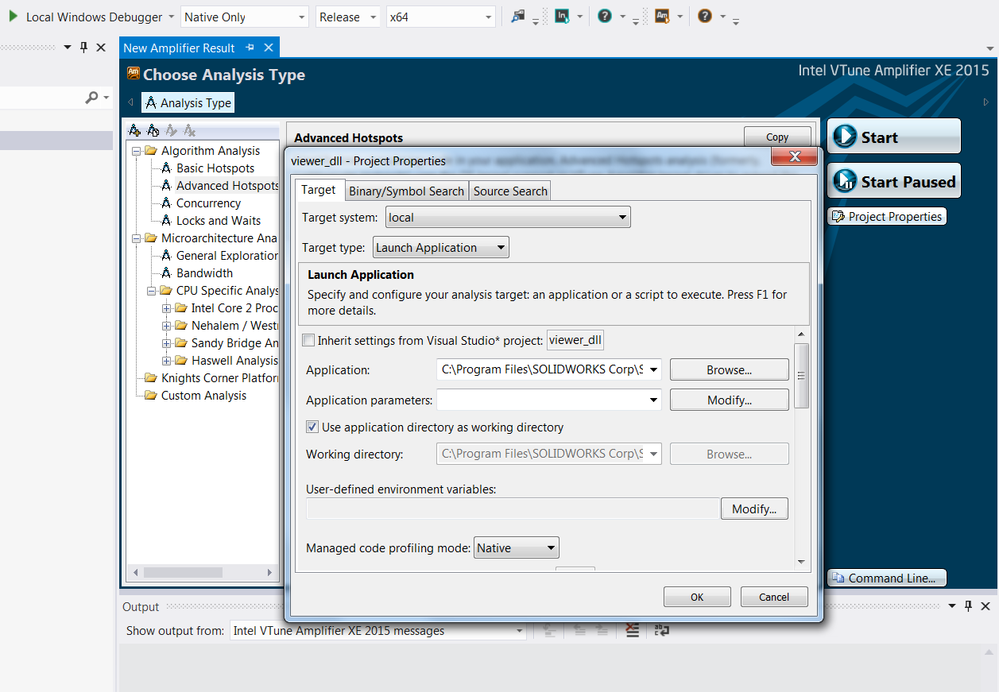
I'm sure that I'm running in Native mode. See pic:
- Mark as New
- Bookmark
- Subscribe
- Mute
- Subscribe to RSS Feed
- Permalink
- Report Inappropriate Content
The path for sldsearchu.dll is the same as SLDWORKS.exe: C:\Program Files\SOLIDWORKS Corp\SOLIDWORKS
And sldsearchu.dll is not the first loaded dll...
And also everything works fine when I run just under MSVS debugger.
Really I don't have enough time to debug dll loading process of third-party application.
- Mark as New
- Bookmark
- Subscribe
- Mute
- Subscribe to RSS Feed
- Permalink
- Report Inappropriate Content
Thank you to confirm.
I still think this is the limitation of the product. Please see my post - 09/28/2014 - 10:57
Assume that you used "native" profiling, scenario was: (Sorry. I'm not familiar with SolidWork, I guess it most likely works in this mechanism)
Layer 1: SolidWork main frame
Layer 2: SolidWork managed code, process all requests.
Layer 3.a: your plug-in dll, talks with managed code to access 3rd-party dlls
Layer 3.b: 3rd-party dlls will receive the request from managed code then executed.
You can see that your plug-in dlls cannot access 3rd-party dlls directly. So, if managed code was not monitored (instrumented), it can call "instrumented" 3rd-part dlls correcty. That is why app-launch mode failed. You can attach running process, because VTune dynamically analyzes "native" dlls directly, without crash.
Back to pause-resume api use, if you put api in your plug-in dll - should be carefully on pause-resume logic, I mean if you start VTune in paused mode, ensure the code (with "resume" action) was not executed when attaching running process. For example, if you start VTune in paused mode, but met your code with pause api again - it will lead unexpected result. Are you sure that VTune profiling will right api?
- Mark as New
- Bookmark
- Subscribe
- Mute
- Subscribe to RSS Feed
- Permalink
- Report Inappropriate Content
Maxim Popov wrote:
Really I don't have enough time to debug dll loading process of third-party application.
This data/analysis would be something for you to post to a SolidWorks forum. They do have several dll load failure problems on their forums.
However, barring that, I think Peter, if I understand correctly, is on the right track for a possible workaround.
If you could put in a call in your code at the right place in order to pause your plugin-execution, then, attach and resume, it might give you the data you need until the SW beta gets updated or whatnot. Even a message box might work. You would need to ignore the data collected for that particular function when you view the data, but depending on what you are collecting, there may be no activity there anyway. I think this is what Peter is saying/suggesting. It might be the quickest, most painless way to get going again.
- Mark as New
- Bookmark
- Subscribe
- Mute
- Subscribe to RSS Feed
- Permalink
- Report Inappropriate Content
>>>This data/analysis would be something for you to post to a SolidWorks forum. They do have several dll load failure problems on their forums>>>
I agree it should be done by SolidWorks devs.
- Subscribe to RSS Feed
- Mark Topic as New
- Mark Topic as Read
- Float this Topic for Current User
- Bookmark
- Subscribe
- Printer Friendly Page
- « Previous
-
- 1
- 2
- Next »

