- Mark as New
- Bookmark
- Subscribe
- Mute
- Subscribe to RSS Feed
- Permalink
- Report Inappropriate Content
The performance counters mem_load_l3_miss_retired.remote_dram and mem_load_l3_miss_retired.local_dram giving wrong numbers when the processes are making accesses to shared memory.
Link Copied
- Mark as New
- Bookmark
- Subscribe
- Mute
- Subscribe to RSS Feed
- Permalink
- Report Inappropriate Content
Hey Akash,
Could you please share with us the below details
1)Which among the different analysis types in vtune are you running, in case if you are running custom analysis could you please share the event names that you are collecting during analysis.
2)Could you please share code snippet for which you are observing this issue so we could reproduce this from our end.
3)Could you also let us know the platform and vtune version you are using.
Arun Jose
- Mark as New
- Bookmark
- Subscribe
- Mute
- Subscribe to RSS Feed
- Permalink
- Report Inappropriate Content
Affected counters: mem_load_l3_miss_retired.remote_dram , mem_load_l3_miss_retired.local_dram
Affected CPU model name: Intel(R) Xeon(R) Gold 6140 CPU @ 2.30GHz
Workload Description:
programs/sharedmem-set.c
It will mmap an amount os memory as shared using and mmap and will fill data. Then it will start random access into this memory.
File link: https://raw.githubusercontent.com/akashiisc/intel-perfcounter-bug/master/programs/sharedmem-set.c
programs/sharedmem-get.c
This program will get the memory allocated by the previous program using shm_open and mmap. It then will do random access in the area.
File link: https://raw.githubusercontent.com/akashiisc/intel-perfcounter-bug/master/programs/sharedmem-get.c
Evaluation Process:
Run program 1 on the CPU of one node with memory binding to same node and launch program 2 on a CPU of another node.
Attach perf to both the process individually
perf stat -a -C $CPU1 -x, -o $OUTFILE1 --append -e mem_load_l3_miss_retired.remote_dram,mem_load_l3_miss_retired.local_dram -p $PID1 -I 5000
perf stat -a -C $CPU2 -x, -o $OUTFILE2 --append -e mem_load_l3_miss_retired.remote_dram,mem_load_l3_miss_retired.local_dram -p $PID2 -I 5000
where $CPU1 is the CPU on which process 1 has been designated to run using numactl, and $CPU2 is the CPU on which process 2 has been designated to run using numactl.
$OUTFILE1 is the output flile for the logs of perf for process 1 and $OUTFILE2 is the output flile for the logs of perf for process 2.
Expected Result :
1. Almost all access to the memory of program 1 should be local access as all its memory is allocated on the same node.
2. Almost all access to the memory of program 2 should be remote access as all its memory is allocated on the other node by process 1.
Result:
I can see a significant amount of remote memory access as reported by the perf counter mem_load_l3_miss_retired.remote_dram.
Note:
You can find my test script on: https://raw.githubusercontent.com/akashiisc/intel-perfcounter-bug/master/test_script.sh
The following GitHub repo contains all the necessary files, binaries, and test scripts.
https://github.com/akashiisc/intel-perfcounter-bug.git
- Mark as New
- Bookmark
- Subscribe
- Mute
- Subscribe to RSS Feed
- Permalink
- Report Inappropriate Content
Hey Akash,
From your response you seem to be collecting the counters using perf tool alone. Perf is a linux utility, though intel makes some contributions to perf, the tool is not managed by Intel.
We handle questions and issues related to vtune in this forum, we could not find the events you mentioned( ie mem_load_l3_miss_retired.remote_dram , mem_load_l3_miss_retired.local_dram) in list of events that vtune collects. If you are using vtune could you please help us with the event names which you collect in vtune or the analysis type that you use.
Thanks
Arun Jose
- Mark as New
- Bookmark
- Subscribe
- Mute
- Subscribe to RSS Feed
- Permalink
- Report Inappropriate Content
Using vtune -collect memory-access to collect memory accesses of my program.
Affected CPU model name: Intel(R) Xeon(R) Gold 6140 CPU @ 2.30GHz
Workload Description:
programs/sharedmem-set.c
It will mmap an amount os memory as shared using and mmap and will fill data. Then it will start random access into this memory.
File link: https://raw.githubusercontent.com/akashiisc/intel-perfcounter-bug/master/programs/sharedmem-set.c
programs/sharedmem-get.c
This program will get the memory allocated by the previous program using shm_open and mmap. It then will do random access in the area.
File link: https://raw.githubusercontent.com/akashiisc/intel-perfcounter-bug/master/programs/sharedmem-get.c
Instructions for vtune:
Since Cpu 0 and 19 lie on different sockets/nodes on my model.
Run program 1 using vtune:
vtune -collect memory-access --cpu-mask=0 -r my_log_dir_2 -- numactl --physcpubind=0 --membind=0 binaries/bin_sharedmem-set
The after 20 seconds, run below command on another terminal
numactl -C 19 binaries/bin_sharedmem-get
Expected Result :
1. Almost all access to memory of program 1 should be local access as all its memory is allocted on the same node.
Actual :
LLC Miss Count: 3,552,052,641
Local DRAM Access Count: 1,967,896,200
Remote DRAM Access Count: 1,771,106,580
Remote Cache Access Count: 0
Expected vtune report is that most of the DRAM access should be local for the program 1 which is executed using vtune.
GitHub Repo: https://github.com/akashiisc/intel-perfcounter-bug.git
- Mark as New
- Bookmark
- Subscribe
- Mute
- Subscribe to RSS Feed
- Permalink
- Report Inappropriate Content
If you are running a recent version of Linux, you should be aware that "automatic NUMA page migration" is enabled by default. In this mode, the OS will monitor memory accesses and will "migrate" pages to the NUMA domain whose cores are performing the most accesses.
Automatic NUMA page migration will not occur if the memory is associated with any non-default NUMA placement policy, so running the initial application under "numactl --membind=0" (for example) will block migration from occurring.
Alternately, the entire mechanism can be turned off by writing "0" to /proc/sys/kernel/numa_balancing"
- Mark as New
- Bookmark
- Subscribe
- Mute
- Subscribe to RSS Feed
- Permalink
- Report Inappropriate Content
@mccalpin, John: I have turned off AutoNUMA migrations by writing "0" to /proc/sys/kernel/numa_balancing". So that the memory is not migrated. Hence the memory is not migrated, all access should be local. numastat -p {pid} shows all the memory allocations on the local node. But still, vtune is reporting remote access as a large chink.
- Mark as New
- Bookmark
- Subscribe
- Mute
- Subscribe to RSS Feed
- Permalink
- Report Inappropriate Content
Hey Akash,
We are looking into your issue. You seem to be getting wrong metrics for dram access using vtune as well as perf.
Could you please check and let us know the collector type(sampling driver) that is being used by vtune. You can find the collector type(driver) that is being used by vtune in
vtune report >>summary pane>> collection and paltform info >>collector type
If you are using sep(vtune sampling driver) driver for collection and have the metrics incorrect for both perf and sep. We suspect this could be because pinning code to a specific socket is not working. We are looking into the code you have provided regarding this and as this requires understanding things bit more deeply we would need some additional time for the triage.
Thanks
Arun Jose
- Mark as New
- Bookmark
- Subscribe
- Mute
- Subscribe to RSS Feed
- Permalink
- Report Inappropriate Content
Hi Arun,
This is what I found as the collector type.
Collector Type: Driverless Perf system-wide sampling
Thanks,
Akash
- Mark as New
- Bookmark
- Subscribe
- Mute
- Subscribe to RSS Feed
- Permalink
- Report Inappropriate Content
Hey Akash,
We have went through you code. And observe similar results of remote dram access metrics when collecting with vtune sampling drivers too. Currently we are performing some experiments pinning the vtune collection and the sharedmem_get binary to different cpu cores to test multiples scenarios to check if these results are expected. We will soon get back to you with an update
Thanks
Arun Jose
- Mark as New
- Bookmark
- Subscribe
- Mute
- Subscribe to RSS Feed
- Permalink
- Report Inappropriate Content
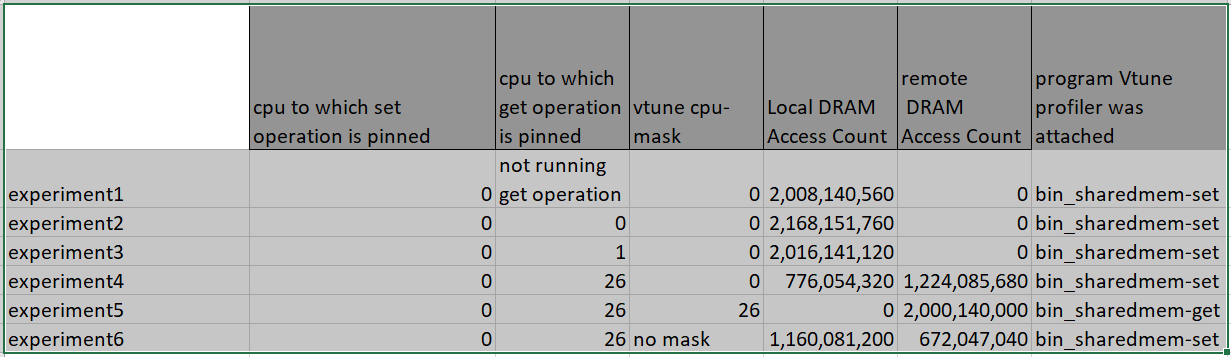
Hey Akash,
We are in the process of debugging the issue. We tried collecting vtune reports for 6 different scenarios using vtune sampling drivers.
The results for scenarios we collected are attached here. Each experiment number is a scenario for which we have collected the reports. Just wanted to run the results by you to check if we are on the same page.
Experiment6 is almost similar to the issue you are facing. For each experiment we have run in the reports we have mentioned the cpu's to which get and set binaries have been pinned and the cpu mask for which the metrics are collected in vtune. In the machine the experiments are done cpu-0 and cpu-26 are on different sockets
As perf and vtune drivers both have similar metrics for remote dram values, we suspect this might not be an issue with the tool. We are checking on this issue and will get back to you soon
Arun Jose
- Mark as New
- Bookmark
- Subscribe
- Mute
- Subscribe to RSS Feed
- Permalink
- Report Inappropriate Content
Understanding the results in these cases is often much easier if the test can be configured to have some fixed/known properties.
VTune uses a sampling methodology, which makes interpreting exact numbers more challenging, while "perf stat" should be measuring the full counts over an interval. If you can configure the test to perform a known number of accesses from each process and use "perf stat" to monitor for the full execution time, then you will be able to compare the reported traffic with the expected traffic.
One possible source of confusion comes from the "memory directory" functionality in the Intel SKX and CLX processors. Reads from remote chips often cause local writes to DRAM to update the memory directory bit(s). More details at https://software.intel.com/en-us/forums/software-tuning-performance-optimization-platform-monitoring/topic/856718#comment-1959925
- Mark as New
- Bookmark
- Subscribe
- Mute
- Subscribe to RSS Feed
- Permalink
- Report Inappropriate Content
Hey Akash
Output numbers from VTune are correct and the only possibility we see is to explore the nature of code. There can be multiple reasons for Remote DRAM accesses - code may have hidden components/requests which are leading to Remote DRAM accesses at places where you are not expecting them, OS policies can affect, underlying architecture’s policies can interfere (as John has commented on the thread).
We will be able to help you if you face any issue related to VTune usage. We did not find any issue with respect to VTune usage.
Unfortunately, your issue looks like related to you code. You may need to look deeper into your code or wait for community help.
Thanks for reaching out to Intel Forums. Please let me know if you further face any issue with VTune usage.
Best regards,
- Mark as New
- Bookmark
- Subscribe
- Mute
- Subscribe to RSS Feed
- Permalink
- Report Inappropriate Content
@Jose Arun (Intel) -- I don't often use the sampling interfaces, but is it possible that the interrupt handler for the sampler and the subsequent run-time processing of the data by the runtime library are adding unexpected remote traffic? (That is the main reason why I asked if the user could build a test with predictable memory access counts.) VTune probably does counter freezing on the initial overflow, but that has known bugs in several processor families, and it is not always easy to be sure that all the transactions initiated in the runtime library have completed their cache transactions before the counters are unfrozen....
I have not used those particular counters a lot because so much data is moved by HW prefetches that changes in these values seem to be only weakly correlated with application performance.... But I am gearing up for a much larger validation study on events related to the memory hierarchy, and these will certainly be included and reviewed.....
- Mark as New
- Bookmark
- Subscribe
- Mute
- Subscribe to RSS Feed
- Permalink
- Report Inappropriate Content
One way to investigate this further is try to see what source lines and instructions the unexpected events are mapped to. You can also look what data address they referenced and see if they are really in address range of the main data array or this is something different. All this is possible in VTune. I suggest to collect Memory Access with memory objects tracking enabled:
vtune -collect memory-access -knob analyze-mem-objects=true ...
and then open collected result in VTune GUI for analysis.
- Mark as New
- Bookmark
- Subscribe
- Mute
- Subscribe to RSS Feed
- Permalink
- Report Inappropriate Content
Hi Arun,
I also checked for the allocated memory on which node using "numastat -p {pid}".
For set process, I found out all its memory allocated to the local node. And for the get process, all the memory allocated on the remote node(i.e. local node for the get process.).
So it is predictable in the above experiment that almost all the memory access from the set process should be local access. And the vtune data doesn't match with this predictability.
@Dmitry Ryabtsev: I will try out your suggestion to get the numbers.
Regards,
Akash
- Mark as New
- Bookmark
- Subscribe
- Mute
- Subscribe to RSS Feed
- Permalink
- Report Inappropriate Content
Hi Arun,
I have repeated the same experiment on Haswell machine [Intel(R) Xeon(R) CPU E7-4850 v3 @ 2.20GHz (4-socket)] as well.
The results I obtained are as per my expectations and totally explainable.
Loads: 108,372,291,170
Stores: 17,774,984,820
LLC Miss Count: 1,805,056,598
Local DRAM Access Count: 1,887,730,946
Remote DRAM Access Count: 0
Remote Cache Access Count: 0
I totally expected these to be the results as the accesses are deterministic to be coming from the local node(as we have bound the memory to the local node using numactl).
So something suspicious with the results on the Skylake machine is what I feel. As these results returned by vtune on the skylake machine cannot be explained.
Explanation of my workload:
programs/sharedmem-set.c: Since the binary of this program is ran with memory bind as well as CPU bind to a particular node. Hence it will allocate all the memory on its local node. This is the program vtune is running for.
Whereas the other program is being run on a CPU of the other socket and is made to access the shared memory being allocated by the previous program. So all the memory access of this program should be remote in nature.
We have run program 1(i.e sharedmem-set) using vtune collecting the memory access for the particular CPU:
with [ vtune -collect memory-access --cpu-mask=0 -r my_log_dir_2 -- numactl --physcpubind=0 --membind=0 binaries/bin_sharedmem-set ]
Ideally, all the access for the program running on the CPU will be served by the local DRAM as per the program behavior. (which is exactly the result I get when I run these on Haswell machine).
But the results with Skylake machine is suspicious and unexplainable.
Regards,
Akash
- Mark as New
- Bookmark
- Subscribe
- Mute
- Subscribe to RSS Feed
- Permalink
- Report Inappropriate Content
Hey Akash,
Sorry for the delay in response.
We tried reproducing the same in a haswell machine and we did still observe remote DRAM access. As we are not able to reproduce this from our end could you please share with us your vtune reports for both cases haswell and skylake zipped along with the binaries and source code. This would help us in analyzing the issue further.
You could use undocumented "-archive" option to pack the binaries into result folder. The option is available in command line::
>vtune -archive -r <my_result_folder>
Arun
- Mark as New
- Bookmark
- Subscribe
- Mute
- Subscribe to RSS Feed
- Permalink
- Report Inappropriate Content
Hey Akash
We are awaiting an update from you side.
Thanks
Arun
- Mark as New
- Bookmark
- Subscribe
- Mute
- Subscribe to RSS Feed
- Permalink
- Report Inappropriate Content
Hi Arun,
Apologies for the delayed response. Actually, earlier I used to get the notifications on my mail whenever a reply was posted. But I am not getting that now. And the earlier portal link was not redirecting me to this new link.
I saw the portal today and saw your replies in it.
I have attached 3 files here:
skylake_logs.tar.gz : the zipped folder which was created after running vtune -archive on skylake machine
skylake_logs.txt : Output of vtune -collect on skylake machine
log_haswell_v1.txt: Output of vtune -collect on haswell machine
I was not able to attach the zipped file of haswell machine because of maximum file size restriction here. So I am attaching the link to it:
log_haswell.tar.gz : https://github.com/akashiisc/intel-perfcounter-bug/blob/master/log_haswell.tar.gz
Regards,
Akash
Thanks,
Akash Panda
- Mark as New
- Bookmark
- Subscribe
- Mute
- Subscribe to RSS Feed
- Permalink
- Report Inappropriate Content
Hi Akash,
Sorry for the delay.
Our vtune architects are looking into the issue. They will soon get back to you with an update.
Thanks
Arun
- Subscribe to RSS Feed
- Mark Topic as New
- Mark Topic as Read
- Float this Topic for Current User
- Bookmark
- Subscribe
- Printer Friendly Page