- Als neu kennzeichnen
- Lesezeichen
- Abonnieren
- Stummschalten
- RSS-Feed abonnieren
- Kennzeichnen
- Anstößigen Inhalt melden
Does VTune work with using perf?
Can Vtune work on hardware which has not an x86 intel CPU inside, e.g. an embedded Samsung CPU?
I use the analyzer checking tool
Intel(R) VTune(TM) Amplifier Self Check Utility
Copyright (C) 2009-2019 Intel Corporation. All rights reserved.
Build Number: 602217Instrumentation based analysis check
Example of analysis types: Hotspots with default knob sampling-mode=sw, Threading with default knob sampling-and-waits=sw
Collection: Ok
Finalization: Ok
amplxe: Warning: Cannot locate debugging information for file `/opt/intel/vtune_amplifier_2019.6.0.602217/lib64/libtpsstool.so'.
Report: OkHW event-based analysis check (Perf)
Example of analysis types: Hotspots with knob sampling-mode=hw, HPC Performance Characterization, etc.
Collection: Ok
amplxe: Warning: Access to /proc/kallsyms file is limited. Consider changing /proc/sys/kernel/kptr_restrict to 0 to enable resolution of OS kernel and kernel modules symbols.
amplxe: Warning: To profile kernel modules during the session, make sure they are available in the /lib/modules/kernel_version/ location.
Finalization: Ok
Report: OkHW event-based analysis check (Perf)
Example of analysis types: Microarchitecture Exploration
Collection: Ok
amplxe: Warning: Access to /proc/kallsyms file is limited. Consider changing /proc/sys/kernel/kptr_restrict to 0 to enable resolution of OS kernel and kernel modules symbols.
amplxe: Warning: To profile kernel modules during the session, make sure they are available in the /lib/modules/kernel_version/ location.
Finalization: Ok
Report: OkHW event-based analysis with uncore events (Perf)
Example of analysis types: Memory Access
Collection: Ok
amplxe: Warning: Access to /proc/kallsyms file is limited. Consider changing /proc/sys/kernel/kptr_restrict to 0 to enable resolution of OS kernel and kernel modules symbols.
amplxe: Warning: To profile kernel modules during the session, make sure they are available in the /lib/modules/kernel_version/ location.
Finalization: Ok
Report: OkHW event-based analysis with stacks (Perf)
Example of analysis types: Hotspots with knob sampling-mode=hw and knob enable-stack-collection=true, etc.
Collection: Ok
amplxe: Warning: Access to /proc/kallsyms file is limited. Consider changing /proc/sys/kernel/kptr_restrict to 0 to enable resolution of OS kernel and kernel modules symbols.
amplxe: Warning: To profile kernel modules during the session, make sure they are available in the /lib/modules/kernel_version/ location.
Finalization: Ok
amplxe: Warning: Cannot locate debugging information for file `/lib/x86_64-linux-gnu/libgcc_s.so.1'.
Report: OkHW event-based analysis with context switches (Perf)
Example of analysis types: Threading with knob sampling-and-waits=hw
Collection: Ok
amplxe: Warning: For analyses using the Perf-based driverless collection, the preemption and synchronization context switches may not be differentiated on kernels older than 4.17. To identify the context switch types on such kernels, switch to the driver-based collection by setting the Stack size option to the unlimited (0) value.
amplxe: Warning: Access to /proc/kallsyms file is limited. Consider changing /proc/sys/kernel/kptr_restrict to 0 to enable resolution of OS kernel and kernel modules symbols.
amplxe: Warning: To profile kernel modules during the session, make sure they are available in the /lib/modules/kernel_version/ location.
Finalization: Ok
Report: OkThe system is ready to be used for performance analysis with Intel VTune Amplifier.
Review warnings in the output above to find product limitations, if any.
But I had to adjust the value in the file perf_event_paranoid to 0
Don't know really what this is needed for, but just found it in a previous run as output:
Please set the /proc/sys/kernel/perf_event_paranoid value to 0 or less to continue without installing the drivers.
Link kopiert
- Als neu kennzeichnen
- Lesezeichen
- Abonnieren
- Stummschalten
- RSS-Feed abonnieren
- Kennzeichnen
- Anstößigen Inhalt melden
Hi, did you run collection as root?
>>But I had to adjust the value in the file perf_event_paranoid to 0
>>Don't know really what this is needed for, but just found it in a previous run as output:
perf_event_paranoid:
- Controls use of the performance events system by unprivileged users (without CAP_SYS_ADMIN). The default value is 2.
- -1: Allow use of (almost) all events by all users Ignore mlock limit after perf_event_mlock_kb without CAP_IPC_LOCK
- >=0: Disallow ftrace function tracepoint by users without CAP_SYS_ADMIN Disallow raw tracepoint access by users without CAP_SYS_ADMIN
- >=1: Disallow CPU event access by users without CAP_SYS_ADMIN
- >=2: Disallow kernel profiling by users without CAP_SYS_ADMIN
- Als neu kennzeichnen
- Lesezeichen
- Abonnieren
- Stummschalten
- RSS-Feed abonnieren
- Kennzeichnen
- Anstößigen Inhalt melden
Thanks for your answer, when I run it as root, I get this output:
sudo ./amplxe-self-checker.sh
Intel(R) VTune(TM) Amplifier Self Check Utility
Copyright (C) 2009-2019 Intel Corporation. All rights reserved.
Build Number: 602217Instrumentation based analysis check
Example of analysis types: Hotspots with default knob sampling-mode=sw, Threading with default knob sampling-and-waits=sw
Collection: Ok
Finalization: Ok
Report: OkHW event-based analysis check (Perf)
Example of analysis types: Hotspots with knob sampling-mode=hw, HPC Performance Characterization, etc.
Collection: Ok
amplxe: Warning: To profile kernel modules during the session, make sure they are available in the /lib/modules/kernel_version/ location.
Finalization: Ok
amplxe: Warning: Cannot locate debugging information for file `/lib/modules/4.15.0-64-generic/updates/dkms/nvidia.ko'.
amplxe: Warning: Cannot locate debugging information for the Linux kernel. Source-level analysis will not be possible. Function-level analysis will be limited to kernel symbol tables. See the Enabling Linux Kernel Analysis topic in the product online help for instructions.
Report: OkHW event-based analysis check (Perf)
Example of analysis types: Microarchitecture Exploration
Collection: Ok
amplxe: Warning: To profile kernel modules during the session, make sure they are available in the /lib/modules/kernel_version/ location.
Finalization: Ok
amplxe: Warning: Cannot locate debugging information for file `/lib/modules/4.15.0-64-generic/kernel/net/netfilter/nf_conntrack.ko'.
amplxe: Warning: Cannot locate debugging information for the Linux kernel. Source-level analysis will not be possible. Function-level analysis will be limited to kernel symbol tables. See the Enabling Linux Kernel Analysis topic in the product online help for instructions.
Report: OkHW event-based analysis with uncore events (Perf)
Example of analysis types: Memory Access
Collection: Ok
amplxe: Warning: To profile kernel modules during the session, make sure they are available in the /lib/modules/kernel_version/ location.
Finalization: Ok
amplxe: Warning: Cannot locate debugging information for file `/lib/modules/4.15.0-64-generic/kernel/arch/x86/kvm/kvm-intel.ko'.
amplxe: Warning: Cannot locate debugging information for file `/lib/modules/4.15.0-64-generic/kernel/net/netfilter/nf_conntrack.ko'.
amplxe: Warning: Cannot locate debugging information for file `/lib/modules/4.15.0-64-generic/updates/dkms/nvidia.ko'.
amplxe: Warning: Cannot locate debugging information for the Linux kernel. Source-level analysis will not be possible. Function-level analysis will be limited to kernel symbol tables. See the Enabling Linux Kernel Analysis topic in the product online help for instructions.
Report: OkHW event-based analysis with stacks (Perf)
Example of analysis types: Hotspots with knob sampling-mode=hw and knob enable-stack-collection=true, etc.
Collection: Ok
amplxe: Warning: To profile kernel modules during the session, make sure they are available in the /lib/modules/kernel_version/ location.
Finalization: Ok
amplxe: Warning: Cannot locate debugging information for file `/lib/modules/4.15.0-64-generic/kernel/drivers/net/ethernet/intel/e1000e/e1000e.ko'.
amplxe: Warning: Cannot locate debugging information for the Linux kernel. Source-level analysis will not be possible. Function-level analysis will be limited to kernel symbol tables. See the Enabling Linux Kernel Analysis topic in the product online help for instructions.
Report: OkHW event-based analysis with context switches (Perf)
Example of analysis types: Threading with knob sampling-and-waits=hw
Collection: Ok
amplxe: Warning: For analyses using the Perf-based driverless collection, the preemption and synchronization context switches may not be differentiated on kernels older than 4.17. To identify the context switch types on such kernels, switch to the driver-based collection by setting the Stack size option to the unlimited (0) value.
amplxe: Warning: To profile kernel modules during the session, make sure they are available in the /lib/modules/kernel_version/ location.
Finalization: Ok
amplxe: Warning: Cannot locate debugging information for file `/lib/modules/4.15.0-64-generic/kernel/net/netfilter/nf_conntrack.ko'.
amplxe: Warning: Cannot locate debugging information for the Linux kernel. Source-level analysis will not be possible. Function-level analysis will be limited to kernel symbol tables. See the Enabling Linux Kernel Analysis topic in the product online help for instructions.
Report: OkThe system is ready to be used for performance analysis with Intel VTune Amplifier.
Review warnings in the output above to find product limitations, if any.
The original value in the file perf_event_paranoid was: 3
So what should I do, can I just set it back to 0 or always run the analyzation as root?
Can you help me also with my first questions?
- Als neu kennzeichnen
- Lesezeichen
- Abonnieren
- Stummschalten
- RSS-Feed abonnieren
- Kennzeichnen
- Anstößigen Inhalt melden
>>So what should I do, can I just set it back to 0 or always run the analyzation as root?
If you could use root when use it :)
>>Does VTune work with using perf?
yes. This is driverless hardware event-based collection in VTune
>>Can Vtune work on hardware which has not an x86 intel CPU inside, e.g. an embedded Samsung CPU?
No. VTune doesn't support non-x86 CPUs. I suppose we could not configure hardware events in this case.
If you could collect perf trace without VTune directly I suggest to use import flow to present data.
Kirill
- Als neu kennzeichnen
- Lesezeichen
- Abonnieren
- Stummschalten
- RSS-Feed abonnieren
- Kennzeichnen
- Anstößigen Inhalt melden
Hello,
There is a pretty good article https://software.intel.com/en-us/vtune-amplifier-cookbook-profiling-hardware-without-sampling-drivers that explains limitations that you might have using profiling through Linux Perf without loading Intel Sampling driver and settings that allow to overcome this limitations.
Thanks & Regards, Dmitry
- Als neu kennzeichnen
- Lesezeichen
- Abonnieren
- Stummschalten
- RSS-Feed abonnieren
- Kennzeichnen
- Anstößigen Inhalt melden
1)
>> yes. This is driverless hardware event-based collection in VTune
What does it means, it is based on perf also when I use an intel hardware?
Or does it use perf when no intel hardware is available?
2)
The output say, that I can use the vtune with hardware event based collection?
3)
Okay, that means working on a non x86 hardware I have to use raw perf as is.
I found also this article:
https://software.intel.com/en-us/vtune-amplifier-help-embedded-linux-targets
Where they installing some drivers into the hardware. This I cannot do when using non-x86 hardware right?
- Als neu kennzeichnen
- Lesezeichen
- Abonnieren
- Stummschalten
- RSS-Feed abonnieren
- Kennzeichnen
- Anstößigen Inhalt melden
VTune is based on perf when the drivers (article you mentioned) are not available. Intel architecture is obligatory for both driver and non-driver (perf) collections.
Non-Intel architecture could be covered over import flow only.
Kirill
- Als neu kennzeichnen
- Lesezeichen
- Abonnieren
- Stummschalten
- RSS-Feed abonnieren
- Kennzeichnen
- Anstößigen Inhalt melden
1)
I have done a trace record with perf now. I had to rename btw. to file to have the suffix .perf to be able to import the file intro vtune
The problem is now. How can I get the debug symbols from the target to use on my system where I run vtune? Otherwise I get no debg symbols.
2)
I use `perf record --pid 12345`
But the stack information seems to be missing. What is a good perf run, so that I get the same information like a native vtune run?
- Als neu kennzeichnen
- Lesezeichen
- Abonnieren
- Stummschalten
- RSS-Feed abonnieren
- Kennzeichnen
- Anstößigen Inhalt melden
>>>2)I use `perf record --pid 12345`
>>>But the stack information seems to be missing. What is a good perf run, so that I get the same information like a native vtune run?
Ok, I'm not sure that vtune command will be usefull for you. We configure events very deeply. For example, ,cpu/period=0xa037a0,umask=0x3,name='CPU_CLK_UNHALTED.REF_TSC'/Duk,
you could try to use standard events from your system
perf -list
collect system wide collection on 2 secs
perf record --call-graph dwarf,1024 -a -o test.perf -e cycles,instructions,cache-references,cache-misses,bus-cycles sleep 2
import will be something like


- Als neu kennzeichnen
- Lesezeichen
- Abonnieren
- Stummschalten
- RSS-Feed abonnieren
- Kennzeichnen
- Anstößigen Inhalt melden
>>>1)I have done a trace record with perf now. I had to rename btw. to file to have the suffix .perf to be able to import the file intro vtune
>>>The problem is now. How can I get the debug symbols from the target to use on my system where I run vtune? Otherwise I get no debg symbols.
You could copy needed files from the target on the host in some specific directory (bb\bb\my_symbols)
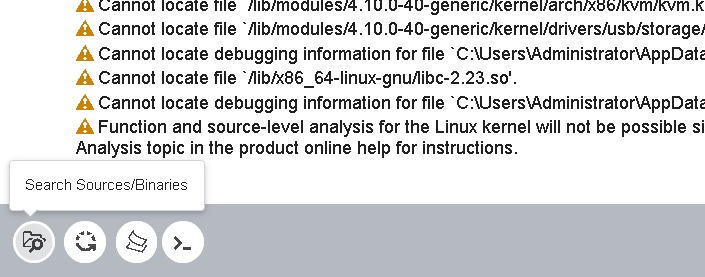
After perf trace was imported go to the 'Collection log' tab and add directory to search source/binaries list and re-resolve results

- RSS-Feed abonnieren
- Thema als neu kennzeichnen
- Thema als gelesen kennzeichnen
- Diesen Thema für aktuellen Benutzer floaten
- Lesezeichen
- Abonnieren
- Drucker-Anzeigeseite