- Mark as New
- Bookmark
- Subscribe
- Mute
- Subscribe to RSS Feed
- Permalink
- Report Inappropriate Content
Hi all,
I ran a simple test case with WRF using the Amplifier XE.
The subroutine which I want to explore was shown only on the assembly presentation. I compiled using :
FCNOOPT = -O0 -fno-inline -fno-ip
FCDEBUG = -g -fp-model precise -shared-intel -debug inline-debug-info -traceback $(FCNOOPT) -traceback
(please see configure.wrf is attached)
How can I build and compiling WRF using the right flags to get through analysis which also shows line within the HotSpoted subroutine ?
Thanks in advance,
Jack.
Link Copied
- Mark as New
- Bookmark
- Subscribe
- Mute
- Subscribe to RSS Feed
- Permalink
- Report Inappropriate Content
Treat WFR(weather and forecasting??) program as regular Fortran code's compiling, usually you need to specify "-g" option.
If you want to view source view without -inline- issue, simply set "-O0" to disable all optimizations. If you use "-O2" option, -inline- function will be enabled by default, you should disable -inline- function separately, for example "-fno-line". If you want to see source line in small routines (-inline- function enabled), you need to use "-debug inline-debug-info".
I don't know if there are other specific requirements for profiling code by using VTune Amplifier XE and Inspector XE, you may refer this article in detail.
- Mark as New
- Bookmark
- Subscribe
- Mute
- Subscribe to RSS Feed
- Permalink
- Report Inappropriate Content
Hello Jack,
Have you tried to double click on the funtion in grid to go to source and right away went to disassembly not asking about particular source location?
Could you do a quick experiment to see that proper debug info is the module:
With the exact bits you use for tuning please try to set a breatpoin on the source line inside the function you explore and run under gdb - if it works - will need to explore the case more from VTune side.
Thanks & Regards, Dmitry
- Mark as New
- Bookmark
- Subscribe
- Mute
- Subscribe to RSS Feed
- Permalink
- Report Inappropriate Content
@ Peter Wang - Thanks Peter. Indeed WRF = weather and forecasting.
@ dmitry-prohorov - Thanks for your replay.
I must have set the flags incorrectley - now I can see the source codes and the call tree to drill into the routine in interest.
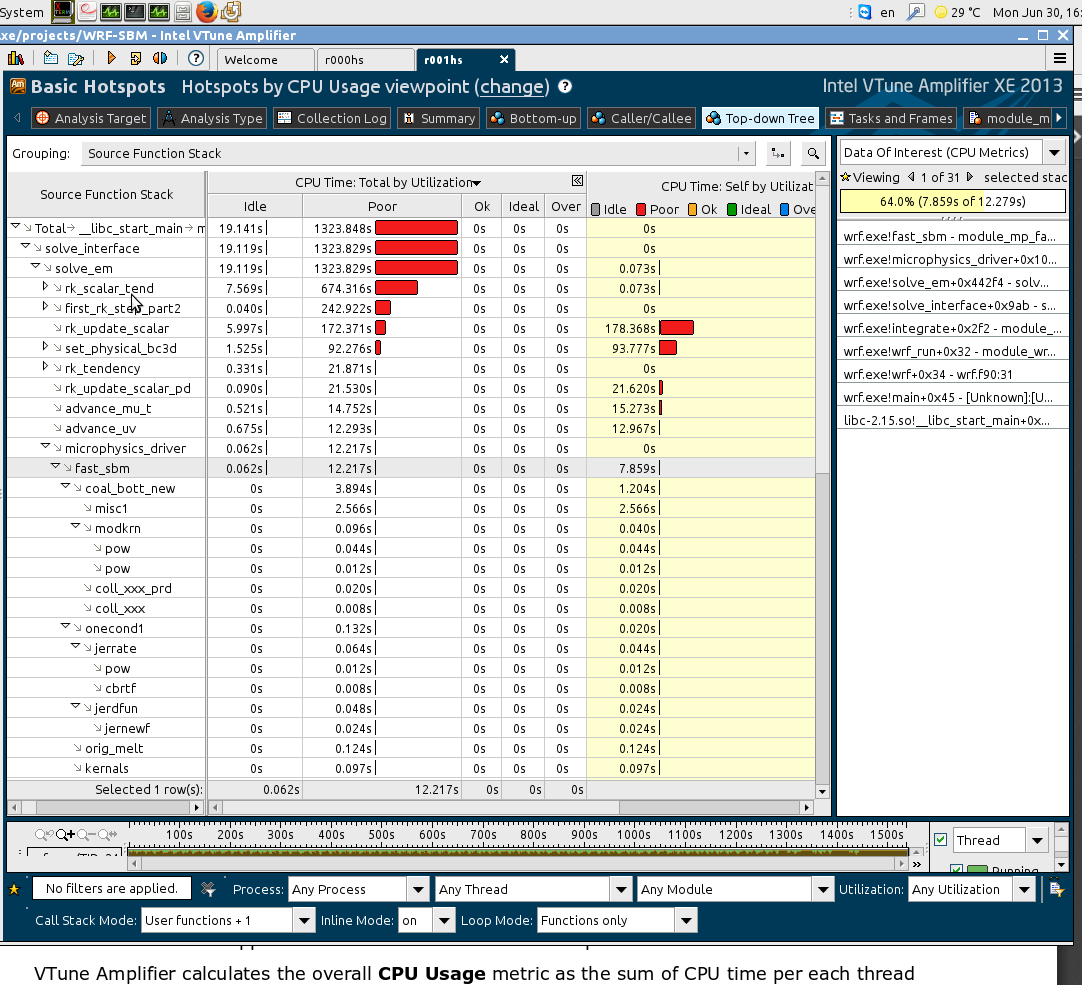
I kindly have a follow-up question. I look at the CPU-total time and CPU-self utilization (please see the attached figure) - can I deduce from this that the suroutine I'm interested in (for example the FAST_SBM) utilize only 64% of the time consumed by the call to this subroutine, i.e., it waits for some reasone (not idle ! ) ?
The time spent over the FAST_SBM routines does not sum-up to the total time of the call to the routine - do I miss something here ?
Also, I would very much appreciate any info about using the Ampifier XE to profile MPI application, Is it also through the advance hot-spot option in the GUI, such as the OpenMP profiling ? Or it is preferable to use Ptrace Analyzer ?
Thanks very much for your time, help and availability !
Jack.
- Mark as New
- Bookmark
- Subscribe
- Mute
- Subscribe to RSS Feed
- Permalink
- Report Inappropriate Content
- Mark as New
- Bookmark
- Subscribe
- Mute
- Subscribe to RSS Feed
- Permalink
- Report Inappropriate Content
Hello Jack,
Could you please check if you attached the screenshot?
On MPI analysis - VTune is a tool to concentrate on one rank profiling. And in this context you can apply any VTune analysis type to explore one one rank performance. Please see this link for details how to configure the analysis. If you need to explore on interprocess MPI communications it would be more efficient to try Intel Trace Analyzer and Collector tool.
Thanks & Regards, Dmitry
- Mark as New
- Bookmark
- Subscribe
- Mute
- Subscribe to RSS Feed
- Permalink
- Report Inappropriate Content
- Mark as New
- Bookmark
- Subscribe
- Mute
- Subscribe to RSS Feed
- Permalink
- Report Inappropriate Content
Hello Jack,
In your case fast_sbm consumes 12.217 + 0.062 = 12.279 of total time and 7.859 of self time so this means that other 12.279 - 7.859 = 4.42 was spend in its callees. So if you expand all nodes under fast_sbm and select them then the sum of all self-times of calless should be equal to 4.42. If I got your question correctly.
Thanks & Regards, Dmitry
- Mark as New
- Bookmark
- Subscribe
- Mute
- Subscribe to RSS Feed
- Permalink
- Report Inappropriate Content
Hi Dimitry,
Thanks for the rapid answers. It is clear now.
I guess that I should also check it across multithread run.
As you now the WRF model has an option of running on both distributed memory and shared memory. We are cheking the possibility of developing code for the WRF model which will use this dual option - how would you recommend debugging and profiling such a code ?
Thanks very much for your perspective,
Jack.
- Subscribe to RSS Feed
- Mark Topic as New
- Mark Topic as Read
- Float this Topic for Current User
- Bookmark
- Subscribe
- Printer Friendly Page