- Mark as New
- Bookmark
- Subscribe
- Mute
- Subscribe to RSS Feed
- Permalink
- Report Inappropriate Content
Hi
I need help to find the miss rate equation using the attached events. I found many equations but I don't know which one is correct. Also in some equations I didn't find the events in my results.
So please whats the equations that I used to find the miss rate using the events in my attached results.
My Processor is E5-2640. Operating System: Microsoft Windows 7.
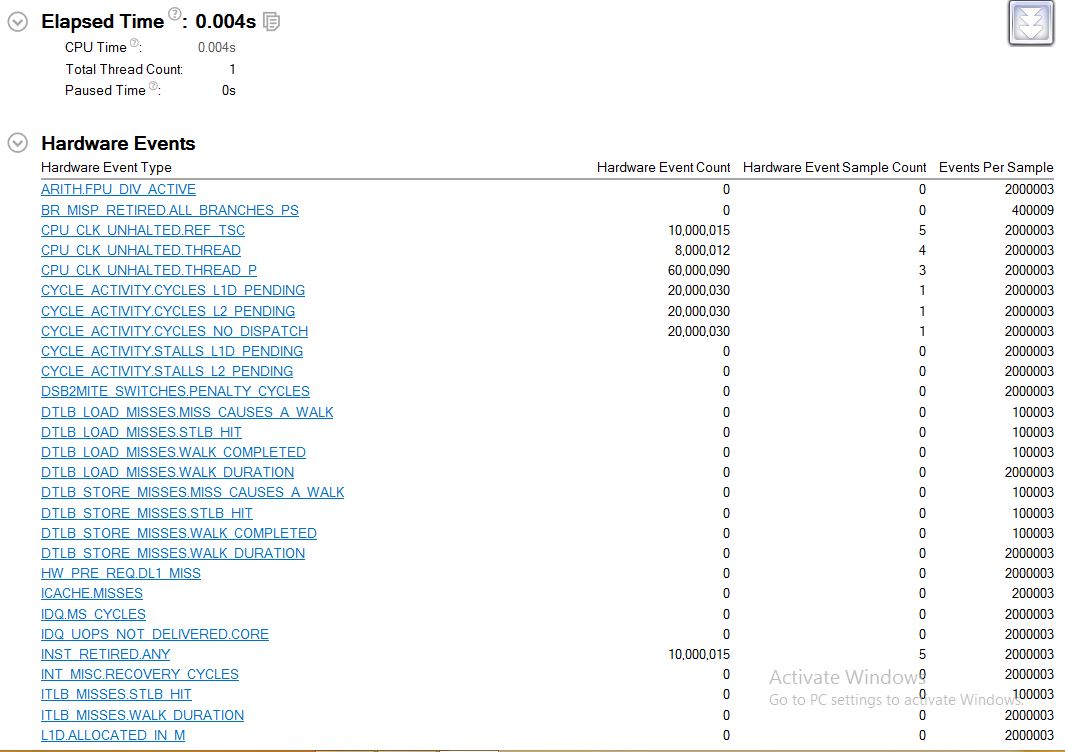
See the attached images for the results.
Thanks
Link Copied
- Mark as New
- Bookmark
- Subscribe
- Mute
- Subscribe to RSS Feed
- Permalink
- Report Inappropriate Content
The processor you are using has 6 cores per socket and supports 1 or 2 sockets. Each core has a private Instruction Cache, a private Data Cache, a private unified L2 cache, and a shared L3 cache. For which cache(s) do you want to know the miss rate?
"Miss Rate" sounds easy to define, but it can be difficult to turn that intuition into a useful quantitative definition. Clearly it involves some count of "misses" divided by some count of something else. Sometimes people want cache misses per instruction (or per 1000 instructions), somtimes people want cache misses per cycle (or per 1000 cycles), sometimes people want cache misses per load operation (or perhaps per load or store operation), sometimes people want counts of cache lines that are transferred to and from each level of the cache. Sometimes people want to count accesses and misses that are due to demand accesses only (i.e., explicit load or store operations in the user code) and sometimes people also want to include accesses and misses that are due to hardware prefetching agents.
Of the great number of combinations of definitions implied by these possibilities, some can be computed accurately using the core hardware performance counters on the Xeon E5-2640, some can be computed approximately using the core hardware counters, some can be computed approximately only with changes to the hardware configuration (e.g., disabling hardware prefetchers or disabling certain hardware bypass paths), some can be computed using a combination of the hardware performance counters in the core and the hardware performance counters in the uncore, and it seems likely that some cannot be computed using the available counters and the currently documented hardware configuration options.
- Mark as New
- Bookmark
- Subscribe
- Mute
- Subscribe to RSS Feed
- Permalink
- Report Inappropriate Content
Thank you Prof. McCalpin for your response.
I am working on my academic research and I want to measure the miss rate for an exe file. This exe file run a certain algorithm. For example sorting algorithm. For me I measure the power consumption for the exe file. Now I want to know is there a relation between the miss rate and power consumption. I want the data miss rate for L1 during the whole operation. Then I will increase the data size and check the miss rate in L2 ... and so on.
Also my exe file has one thread and I set the affinity for my exe file and thread to be run on Core 0 only.
I compile my code using Visual Studio 2012.
Thank you again for your support.
Regards
- Mark as New
- Bookmark
- Subscribe
- Mute
- Subscribe to RSS Feed
- Permalink
- Report Inappropriate Content
Hello Naif,
Let me recommend to try General Exploration analysis in VTune - it has "Back-End Bound/Memory Bound" metric sub-tree that allows to see cycles stalled on different cache levels or fetching data from DRAM etc.
Thanks & Regards, Dmitry
- Mark as New
- Bookmark
- Subscribe
- Mute
- Subscribe to RSS Feed
- Permalink
- Report Inappropriate Content
To compute the L1 Data Cache Miss Rate per load you are going to need the MEM_UOPS_RETIRED.ALL_LOADS event, which does not appear to be on your list of events. (Your software may have hidden this event because of some known hardware bugs in the Xeon E5-26xx processors -- especially when HyperThreading is enabled.
But that is OK, since you don't really need to know the miss rate per load -- the miss rate per instruction will work just as well. To get this you need to convince your software to measure the L1D.REPLACEMENT and the INST_RETIRED.ANY events. Each L1D.REPLACEMENT event corresponds to a cache line being brought into the L1 cache, so you can easily calculate a metric of cache misses per 1000 instructions retired. The L1D.REPLACEMENT event will include cache lines brought into the L1 Data Cache due to loads, stores, or due to hardware prefetches. This should be fine for your tests -- if power consumption is associated with data motion, then counting all the data motion (load, store, and prefetch) seems reasonable.
- Mark as New
- Bookmark
- Subscribe
- Mute
- Subscribe to RSS Feed
- Permalink
- Report Inappropriate Content
Thank you Prof. McCalpin for your perfect support. You help to know many things about my research experiments.
Regarding the hardware bug in Xeon E5-26xx processors, can you please suggest an intel processor that doesn't have this bug.
Thank you again for your support.
Regards,
Naif, PhD Student
- Mark as New
- Bookmark
- Subscribe
- Mute
- Subscribe to RSS Feed
- Permalink
- Report Inappropriate Content
The particular bug I was thinking of was for the event MEM_UOP_RETIRED.LOADS, which can give incorrect results if HyperThreading is enabled. This is documented in the processor specification update for Sandy Bridge (errata BT243 in document 326510 "Intel Xeon Processor E5 Family: Specification Update") and for Ivy Bridge (errata CA93 in document 329189 "Intel Xeon Processor E5 v2 Product Family: Specification Update"). This bug is not mentioned in the specification update documents for the Xeon E5 v3 (Haswell) processors, so it may have been fixed.
- Mark as New
- Bookmark
- Subscribe
- Mute
- Subscribe to RSS Feed
- Permalink
- Report Inappropriate Content
Thank you Prof. McCalpin for your answer.
I am wondering, the MEM_UOPS_RETIRED.ALL_LOADS event, doesn't appear even if the hyperthreading is disabled.
In my research experiments I disable the hyperthreading.
Regards,
Naif, PhD Student
- Mark as New
- Bookmark
- Subscribe
- Mute
- Subscribe to RSS Feed
- Permalink
- Report Inappropriate Content
I don't know errata in document about using event of memory loads when HT is enabled. I think that Prof. McCalpin meant if you enabled HT, collected event counts will be incorrect (event is enabled whatever HT is enabled or not). All memory loads event is supported in Intel(R) Xeon(R) processors, but they might have different event name, for example -
1. Sandbridge processors
> amplxe-cl -collect-with runsa -knob event-config=? | grep LOADS
MEM_INST_RETIRED.LOADS Instructions retired which contains a load
2. Haswell processors
> amplxe-cl -collect-with runsa -knob event-config=? | grep LOADS
MEM_UOPS_RETIRED.ALL_LOADS All retired load uops.
One is UOPS retired of memory loads and another is instruction retired of memory loads.
- Mark as New
- Bookmark
- Subscribe
- Mute
- Subscribe to RSS Feed
- Permalink
- Report Inappropriate Content
I don't know why MEM_UOPS_RETIRED.ALL_LOADS is not available on your system. On some Linux systems this event is not supported when HT is enabled (because of the bugs I referred to above). It is possible that Windows does not make it available for the same reason (even if HyperThreading is disabled).
The OS cannot actually disable the event -- it can only choose not to make it available by name. If your software has an interface that allows "raw" programming of the performance counter event select registers, then you can still select the event using the Event Code 0xD0 with Umask 0x81. I usually set all the bits -- in this case you would use: 0x004381D0
- Subscribe to RSS Feed
- Mark Topic as New
- Mark Topic as Read
- Float this Topic for Current User
- Bookmark
- Subscribe
- Printer Friendly Page