- Mark as New
- Bookmark
- Subscribe
- Mute
- Subscribe to RSS Feed
- Permalink
- Report Inappropriate Content
I'm compiling and running a VS C++ application and then running it stand-alone with Vtune XE 2013
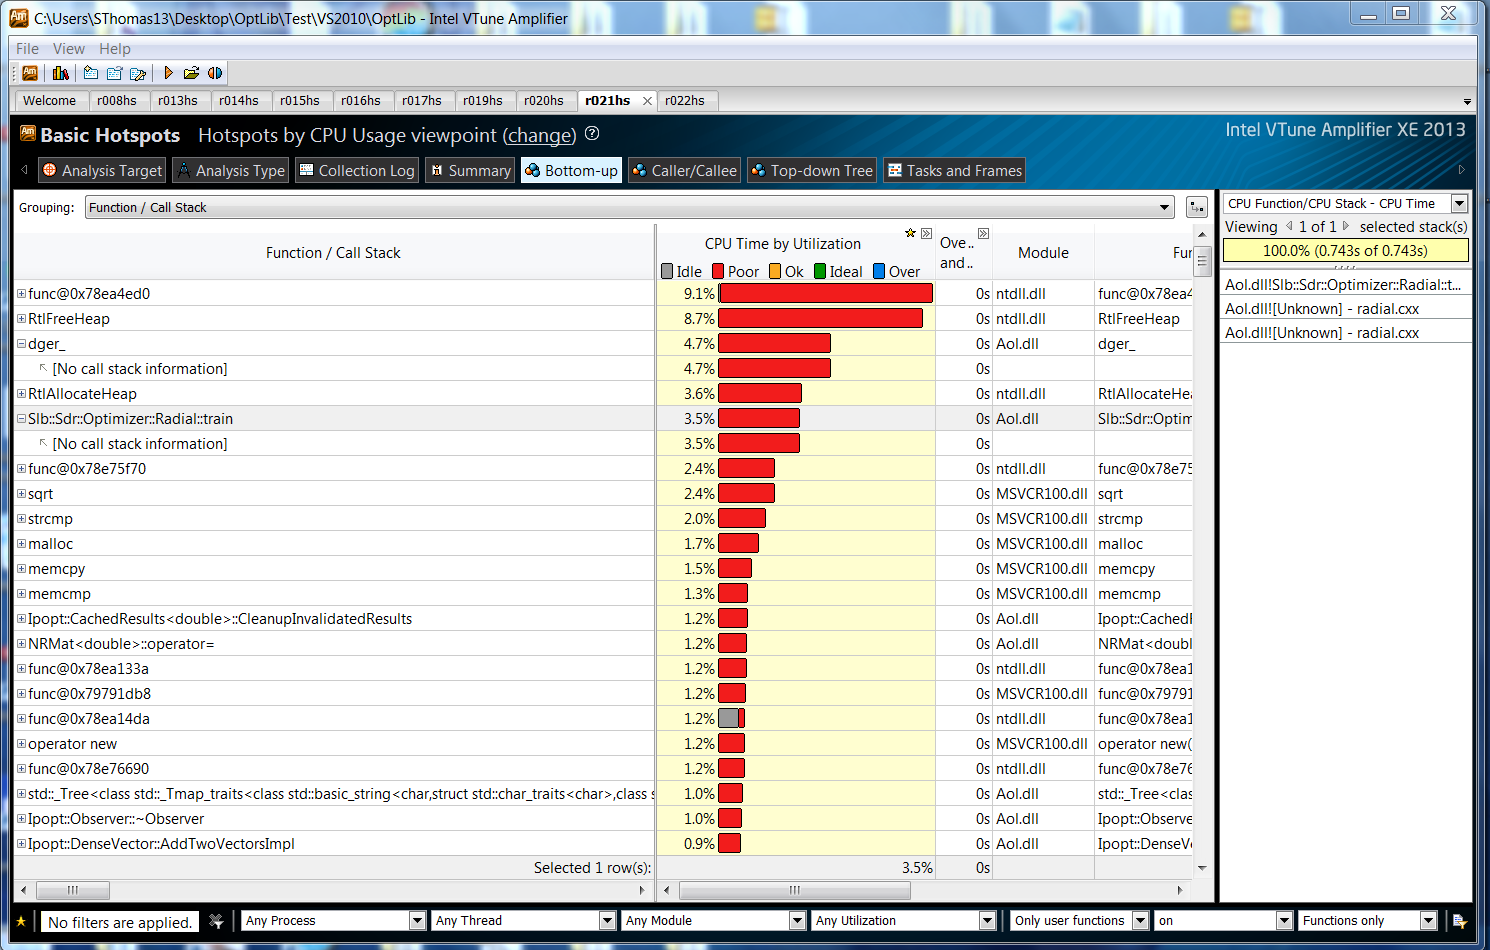
It was working fine and I could see the top-down and bottom-up calls trees but now for some reason
these will not go further than one level - is there something broken, set-up,
What have I gone and done ?
Steve
stephethomas@gmail.com
Link Copied
- Mark as New
- Bookmark
- Subscribe
- Mute
- Subscribe to RSS Feed
- Permalink
- Report Inappropriate Content
Hi Stephen - Is it possible you have set the filter by accident? The "call-stack-mode" at the bottom?
Could you post a screen-shot?
- Mark as New
- Bookmark
- Subscribe
- Mute
- Subscribe to RSS Feed
- Permalink
- Report Inappropriate Content
- Mark as New
- Bookmark
- Subscribe
- Mute
- Subscribe to RSS Feed
- Permalink
- Report Inappropriate Content
Hi Steve,
Could you share your vtune amplifier xe result directory?(or if you prefer... you could send it to me directly)
Also... what compiler version are you using?
Kevin
- Mark as New
- Bookmark
- Subscribe
- Mute
- Subscribe to RSS Feed
- Permalink
- Report Inappropriate Content
I'm using the Visual Studio C++ compiler, 2010
Can I send the result directory to you (zip'ed )
- Mark as New
- Bookmark
- Subscribe
- Mute
- Subscribe to RSS Feed
- Permalink
- Report Inappropriate Content
- Mark as New
- Bookmark
- Subscribe
- Mute
- Subscribe to RSS Feed
- Permalink
- Report Inappropriate Content
Hi Stephen!
I see your results are collected with "--mrte-mode=managed" - in VS it is inherited from VS settings (debugging -> managed). Since your application is native, you need to change this option.
If you are unable to find this setting in VS, you can try standalone VTune (not the one integrated to VS) - create new project and run Basic Hotspots there, you should see call stacks now.
- Mark as New
- Bookmark
- Subscribe
- Mute
- Subscribe to RSS Feed
- Permalink
- Report Inappropriate Content
Hi Vitaly
I have been running in Stand-Alone Vtune without launching from Visual Studio. Would this make a difference ?
What would you recommend. Should I somehow start over and create a new project in VTune ?
I can not find the option you mentioned in VS, would it be under compiler C++ or linker ?
Thanks
Stephen
- Mark as New
- Bookmark
- Subscribe
- Mute
- Subscribe to RSS Feed
- Permalink
- Report Inappropriate Content
Found the tools, debugging options, I'm using VS2010 so the compatabilty mode is not an
available option
There has to be some other reason why the call stacks are not showing up ?
- Mark as New
- Bookmark
- Subscribe
- Mute
- Subscribe to RSS Feed
- Permalink
- Report Inappropriate Content
Stephen, please check the following options in VS (depending on VS version):
- Configuration Properties -> Debugging -> Debugger Type (should be Auto or Native)
- Debug -> Enable unmanaged code debugging (should be turned on)
If you collect data using VTune standalone, please make sure the following option has correct value:
- Project Properties -> Managed code profiling mode = Auto or Native
- Mark as New
- Bookmark
- Subscribe
- Mute
- Subscribe to RSS Feed
- Permalink
- Report Inappropriate Content
Thank-you !!!
It was set to Managed in Vtune and switching to Auto corrected the problem
Much appreciated !
- Subscribe to RSS Feed
- Mark Topic as New
- Mark Topic as Read
- Float this Topic for Current User
- Bookmark
- Subscribe
- Printer Friendly Page