- Mark as New
- Bookmark
- Subscribe
- Mute
- Subscribe to RSS Feed
- Permalink
- Report Inappropriate Content
Hello,
I have storage (WDF) filter driver for which I want to do performance analysis using VTune.
I have provided the right path for .pdb file (symbol file).
I'm running IOs through IO-meter as it has to go through our windows filter driver.
Though it collects the sampling data, I do not see any of our driver's symbols at all? I have tried both Windows 2008 and Windows 2012.
What am I missing? Please help.
Thanks,
Link Copied
- Mark as New
- Bookmark
- Subscribe
- Mute
- Subscribe to RSS Feed
- Permalink
- Report Inappropriate Content
You said that you put right path for searching symbol file, you may re-check this:"amplxe-cl -finalize --search-dir all:rp=new-dir -r result-directory". Have you seen something like "resolving information for driver module..."?
If you see like "Warning:...Cannot locate file at your interest of module" - please submit this problem to Intel Premier with result dir, module with pdb file for investigating. However you may check if your driver/pdb files has debug info, I remember utility dumpbin can be used?
Regards, Peter
- Mark as New
- Bookmark
- Subscribe
- Mute
- Subscribe to RSS Feed
- Permalink
- Report Inappropriate Content
You can also use windbg for checking loaded pdb file.
- Mark as New
- Bookmark
- Subscribe
- Mute
- Subscribe to RSS Feed
- Permalink
- Report Inappropriate Content
Try also this one:
SymChk
http://msdn.microsoft.com/en-us/library/windows/hardware/ff558844(v=vs.85).aspx
- Mark as New
- Bookmark
- Subscribe
- Mute
- Subscribe to RSS Feed
- Permalink
- Report Inappropriate Content
Hello,
my pdb file has proper symbols. but when I tried the following (as suggested), I got error.
C:\Program Files (x86)\Intel\VTune Amplifier XE 2013\bin32>amplxe-cl -finalize --search-dir all:rp=c:\amd64 -r c:\MCP_CPU
amplxe: Error: Result path `c:\MCP_CPU' does not exist.
Thanks,
- Mark as New
- Bookmark
- Subscribe
- Mute
- Subscribe to RSS Feed
- Permalink
- Report Inappropriate Content
The results directory should be the directory where you collected the Amplifier XE results, originally. What are the contents of c:\MCP_CPU?
- Mark as New
- Bookmark
- Subscribe
- Mute
- Subscribe to RSS Feed
- Permalink
- Report Inappropriate Content
Here are the contents of c:\MCP_CPU
===========================================
C:\Program Files (x86)\Intel\VTune Amplifier XE 2013\bin32>dir c:\MCP_CPU
Volume in drive C has no label.
Volume Serial Number is 3810-44B3
Directory of c:\MCP_CPU
03/31/2014 11:19 AM <DIR> .
03/31/2014 11:19 AM <DIR> ..
03/31/2014 11:16 AM <DIR> r000hs
03/31/2014 11:21 AM <DIR> r001hs
0 File(s) 0 bytes
4 Dir(s) 44,421,107,712 bytes free
C:\Program Files (x86)\Intel\VTune Amplifier XE 2013\bin32>dir c:\MCP_CPU\r001hs
Volume in drive C has no label.
Volume Serial Number is 3810-44B3
Directory of c:\MCP_CPU\r001hs
03/31/2014 11:21 AM <DIR> .
03/31/2014 11:21 AM <DIR> ..
03/31/2014 11:21 AM 0 .norun
03/31/2014 11:21 AM <DIR> config
03/31/2014 11:21 AM <DIR> data.0 ==>> this folder has good amount of collected sample data.
03/31/2014 11:21 AM 709 r001hs.amplxe
03/31/2014 11:21 AM <DIR> sqlite-db
2 File(s) 709 bytes
5 Dir(s) 44,421,107,712 bytes free
======================================================================
- Mark as New
- Bookmark
- Subscribe
- Mute
- Subscribe to RSS Feed
- Permalink
- Report Inappropriate Content
Hello,
Somehow my snapshot of "dir" command to that folder is blocked by site administrator.
Anyway, content of c:\MCP_CPU is as follows
It has folder called "r001hs"
C:\Program Files (x86)\Intel\VTune Amplifier XE 2013\bin32>dir c:\MCP_CPU\r001hs
This has the following folders and files:
.norun
config
data.0 ==>> This folder has good amount of collected data.
r001hs.amplxe
sqlite-db ===>> It has a big db file.
2 File(s)
5 Dir(s)
====================================
Thanks,
- Mark as New
- Bookmark
- Subscribe
- Mute
- Subscribe to RSS Feed
- Permalink
- Report Inappropriate Content
Are you saying you don't have access to that directory? That would be a problem.
Anyway, you need to specify the r001hs as the results directory in your command line, not just MCP_CPU. So your command should be:
amplxe-cl -finalize --search-dir all:rp=c:\amd64 -r c:\MCP_CPU\r001hs
- Mark as New
- Bookmark
- Subscribe
- Mute
- Subscribe to RSS Feed
- Permalink
- Report Inappropriate Content
Thanks Anderson!
I have updated symbol path and result path. Here is the result of "amplxe-cl".
C:\Program Files (x86)\Intel\VTune Amplifier XE 2013\bin32>amplxe-cl -finalize --search-dir all:rp=SRV*C:\Download_tools\_iometer-1.1.0-rc1-win32.i386-bin\symbols*http://msdl.microsoft.com/download/symbols -r c:\MCP_CPU\r002hs
amplxe: Using result path `c:\MCP_CPU\r002hs'
amplxe: Executing actions 35 % Resolving information for `SHELL32.dll'
amplxe: Warning: Cannot locate debugging symbols for file `C:\Download_tools\_iometer-1.1.0-rc1-win32.i386-bin\IOMETER.exe'.
amplxe: Executing actions 39 % Resolving information for `MSWSOCK.DLL'
amplxe: Warning: Cannot locate debugging symbols for file `C:\Program Files (x86)\Intel\VTune Amplifier XE 2013\bin32\tpsstool.dll'.
amplxe: Warning: Cannot locate debugging symbols for file `C:\Download_tools\_iometer-1.1.0-rc1-win32.i386-bin\DYNAMO.exe'.
amplxe: Executing actions 100 % done
Questions:
If I only interested in my driver symbols, do I still have to resolve other symbols (including kernel)?
I still do not see my driver symbols getting resolved.
Thanks,
-Raj P.
- Mark as New
- Bookmark
- Subscribe
- Mute
- Subscribe to RSS Feed
- Permalink
- Report Inappropriate Content
You only need to provide symbols for what you want to see symbols. :)
First, are you sure there are samples in your driver? Ah, okay. I just answered my own question. Basic Hotspots (which is what r001hs means) only collects user-mode samples. To profile drivers, you must use Advanced Hotspots or one of the advanced analysis types, like General Exploration.
Which version are you using, btw? If you are using 2013 Update 16, please see the Help topic: Attaching to a Process.
- Mark as New
- Bookmark
- Subscribe
- Mute
- Subscribe to RSS Feed
- Permalink
- Report Inappropriate Content
>>>If I only interested in my driver symbols, do I still have to resolve other symbols (including kernel)?>>>
Usually only if you are interested in profiling kernel mode code.
- Mark as New
- Bookmark
- Subscribe
- Mute
- Subscribe to RSS Feed
- Permalink
- Report Inappropriate Content
Hello Anderson,
Yes, I'm using 2013 Update 16 (build 342405).
As per suggestion, I switched to Advanced Hotspots. Now it appears to be sampling kernel modules as well. Unfortunately, I still don't see my driver symbols getting resolved.
FYI, using windbg, I could set breakpoints.
Thanks,
-Raj P.
- Mark as New
- Bookmark
- Subscribe
- Mute
- Subscribe to RSS Feed
- Permalink
- Report Inappropriate Content
>>>FYI, using windbg, I could set breakpoints>>>
Can you your symbols while debugging?
- Mark as New
- Bookmark
- Subscribe
- Mute
- Subscribe to RSS Feed
- Permalink
- Report Inappropriate Content
Hello,
I am not quite sure I understood your question. If you don't mind, please elaborate.
Thanks,
-Raj P.
- Mark as New
- Bookmark
- Subscribe
- Mute
- Subscribe to RSS Feed
- Permalink
- Report Inappropriate Content
The question is, do you see any samples in your driver's module? Switch to the "Module / Function / Call stack" grouping. Do you see your module in the list?
- Mark as New
- Bookmark
- Subscribe
- Mute
- Subscribe to RSS Feed
- Permalink
- Report Inappropriate Content
Hello Anderson,
I do not see my module in the list. :-(
Thanks,
-Raj P.
- Mark as New
- Bookmark
- Subscribe
- Mute
- Subscribe to RSS Feed
- Permalink
- Report Inappropriate Content
Are you exercising the code in your driver enough to collect samples in your driver? If you're not spending enough time in the code, you won't get any samples. This is common in driver code, since driver code is typically doing things as quickly as possible so as not to slow the system. Can you estimate how much time you expect to spend in your driver code during the sampling session?
Your test harness should ensure that your driver code gets exercised a lot.
- Mark as New
- Bookmark
- Subscribe
- Mute
- Subscribe to RSS Feed
- Permalink
- Report Inappropriate Content
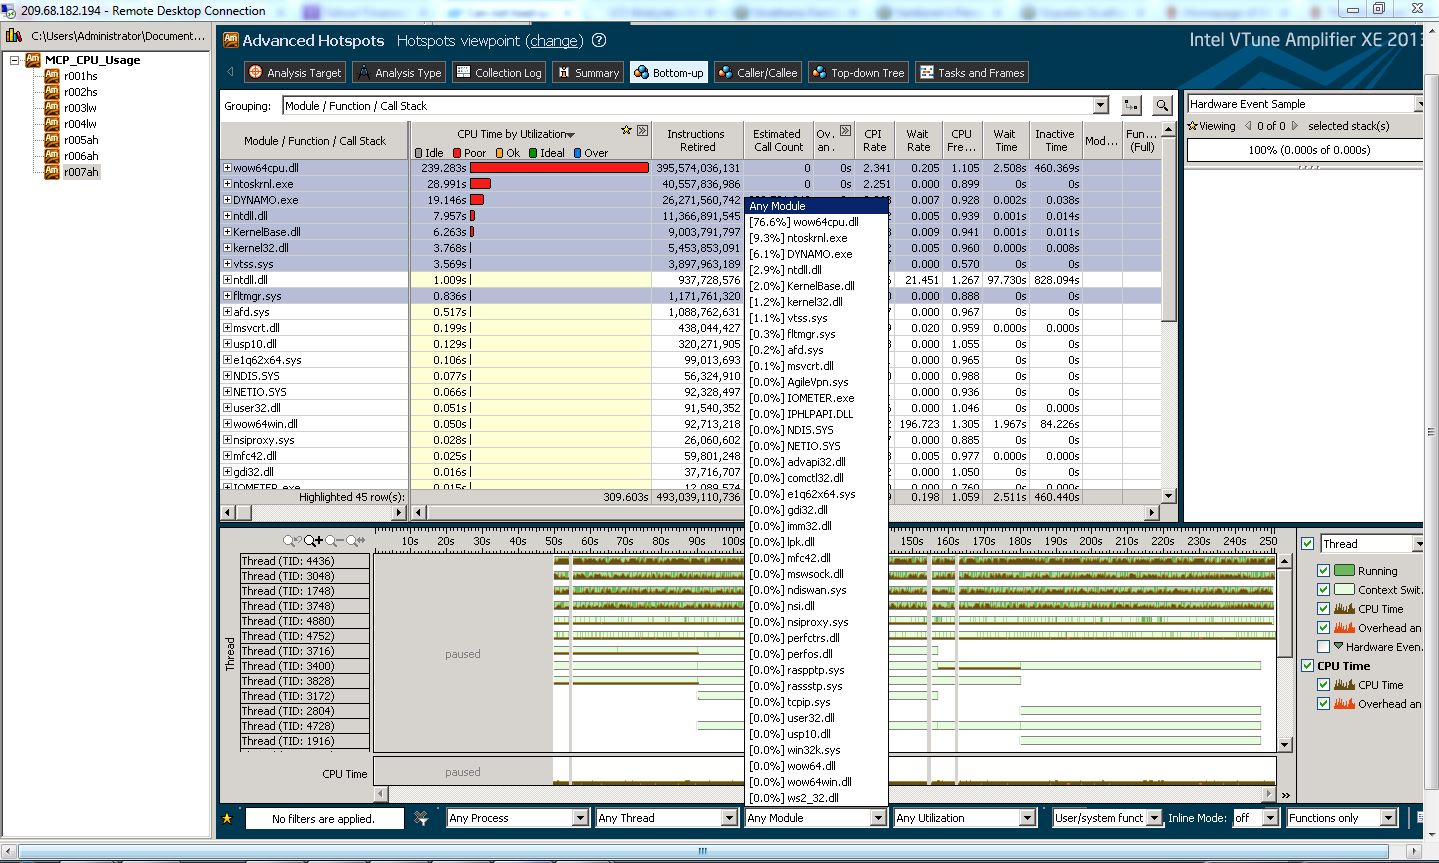
Yes, I do run my test about 2 to 3 minutes. Please let me know if you think it's not enough. Each and every IO has to go through my driver.
Please find the jpeg file to see find if anything obvious. btw, my driver name tapwdffltr.sys
Is it possible to do remote sessions or conf. call help further?
Thanks
- Mark as New
- Bookmark
- Subscribe
- Mute
- Subscribe to RSS Feed
- Permalink
- Report Inappropriate Content
No, not in general. If you have an Intel field representative, you can contact him/her and ask for assistance.
I highly suspect your code isn't executing enough. Notice there are several drivers in the module list.
When I talked about estimated code execution time, I was referring to the code path likely taken in your driver. How many instructions and can you estimate the number of cycles it would take, on average, to execute that sequence of instructions? If it is very small, say <200 us, and you are sampling at 1 ms, you may well miss your code!
Another thing you might have to do is to change the Target type to "Profile system" from "Launch application." Are you configuring VTune Amplifier to launch an application? If so, I believe this can cause a problem since your driver typically does not execute in the context of a single application, but rather on the stack of whatever thread was executing when it was given the CPU by the OS.
You can try to increase the sample rate, with the understanding that the results may be less accurate because of increased overhead, but will increase the likelihood that you get samples in your code. Make sure you are correctly setting the "Duration estimate time" value in the project properties. This setting will adjust the sample rate to increase accuracy.
- Mark as New
- Bookmark
- Subscribe
- Mute
- Subscribe to RSS Feed
- Permalink
- Report Inappropriate Content
PING-CHING Y. wrote:
Hello,
I am not quite sure I understood your question. If you don't mind, please elaborate.
Thanks,
-Raj P.
Sorry for improperly formulated question:)
I wanted to ask if you can use your private symbols while debugging your driver?
- Subscribe to RSS Feed
- Mark Topic as New
- Mark Topic as Read
- Float this Topic for Current User
- Bookmark
- Subscribe
- Printer Friendly Page