- Mark as New
- Bookmark
- Subscribe
- Mute
- Subscribe to RSS Feed
- Permalink
- Report Inappropriate Content
Hi,
Does oneAPI provide any tool to inspect the command queues and SYCL/OpenCL operations performed?
In other platforms, such as AMD, we have CodeXL to inspect the OpenCL of CPU/GPU devices.
In the past (1-2y ago) I tried to use VTune to profile/inspect OpenCL calls in Intel devices, but it only worked for GPUs.
I want to see the parallelization and bottlenecks, if I am doing something wrong with the buffers/memory, since I am running matmul with oneAPI and I get in CPU 25s, in iGPU 5s, but when using CPU+GPU (workload splitted accordingly, iGPU with 95% CPU with 5% aprox), I get around 7s. I did many tests and never below 5s, so, something must be wrong.. but I would like to know how can I inspect the real OpenCL operations performed and if they are executed in parallel (I don't mind if is GUI or CLI).
Doing manual profiling (chrono + profiling queues) I can see this:
selecting
cpu selector
selecting
gpu selector
0.275022 gpu submit
Running on: Intel(R) Gen9 size: 2304 offset: 0
0.43391 cpu submit
Running on: Intel(R) Core(TM) i5-6200U CPU @ 2.30GHz size: 256 offset: 2304
6.95277 gpu callback function
gpu queue 6220.89 ms
6.97933 exit gpu
7.50185 cpu callback function
cpu queue 6248.3 ms
7.53788 exit cpu
Link Copied
- Mark as New
- Bookmark
- Subscribe
- Mute
- Subscribe to RSS Feed
- Permalink
- Report Inappropriate Content
Hey
Vtune has 2 reports for analysis of cpu/gpu OpenCL kernels.
1)GPU Offload analysis
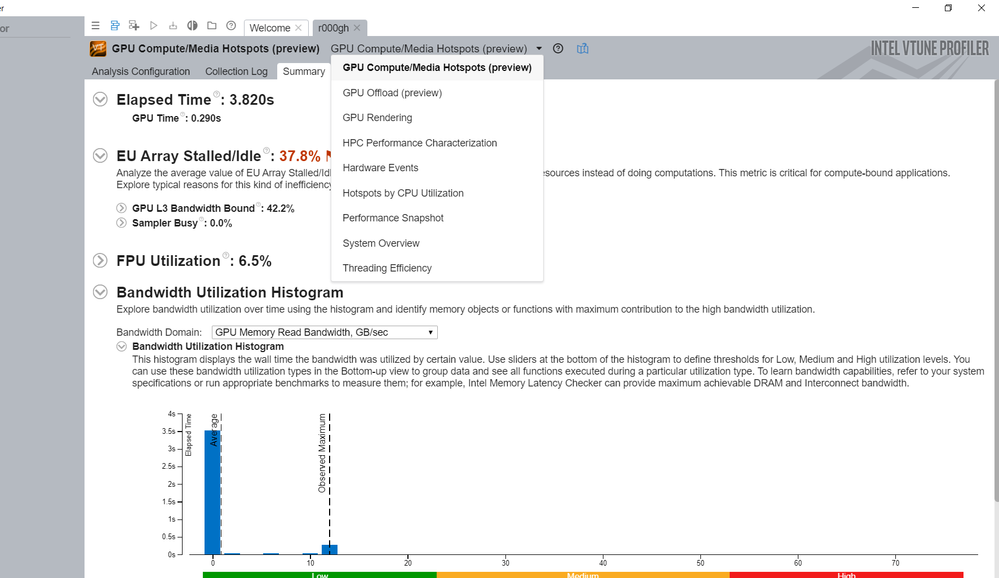
2)GPU compute media hotspot analysis
You could use vtunes "GPU Offload analysis" to analyze CPU-based workloads together with GPU-based workloads within a unified time domain. In this analysis type in the GUI there is an option to Collect CPU-side stacks this option can be used to analyze call stacks executed on the CPU and identify critical paths.
You could use the time line pane in the graphics pane to compare how effectively your program uses OpenCL kernels and further analysis on this can be done with GPU Compute/Media Hotspots analysis.
In "GPU compute media hotspot analysis" report the graphics window displays CPU and GPU usage data per thread and provides an extended list of GPU hardware metrics that help analyze accesses to different types of GPU memory. You could also analyse the cpu hotspots in the same report by navigating to cpu hotspots view in vtune report. Please find attached a screen print to list and navigate to multiple views in vtune.
Hope this helps
Thanks
Arun
- Mark as New
- Bookmark
- Subscribe
- Mute
- Subscribe to RSS Feed
- Permalink
- Report Inappropriate Content
Hey @RN1,
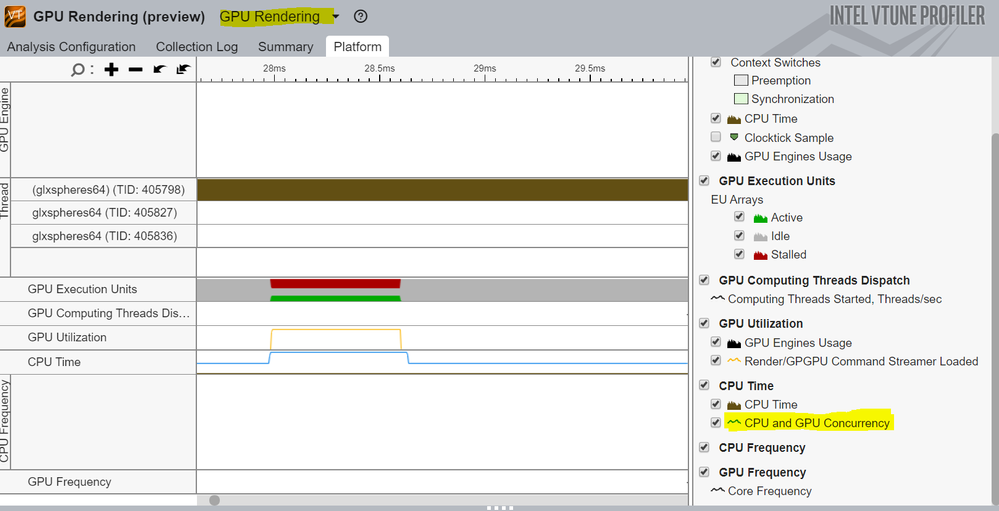
To add on to my answer if you are looking particularly for cpu gpu concurrency. You can select the GPU rendering view in the vtune report.
In "GPU rendering" view in the platform pane you can see the gpu and cpu utilisation in a time series line plot. It also gives the cpu-gpu concurrency.
Please find attached a screen print for reference.
Thanks
Arun Jose
- Mark as New
- Bookmark
- Subscribe
- Mute
- Subscribe to RSS Feed
- Permalink
- Report Inappropriate Content
Hey RN1,
Have you tried out the solution provided. Does that resolve your issue? Please let us know in case you need any other information.
Thanks
Arun
- Mark as New
- Bookmark
- Subscribe
- Mute
- Subscribe to RSS Feed
- Permalink
- Report Inappropriate Content
Hey RN1,
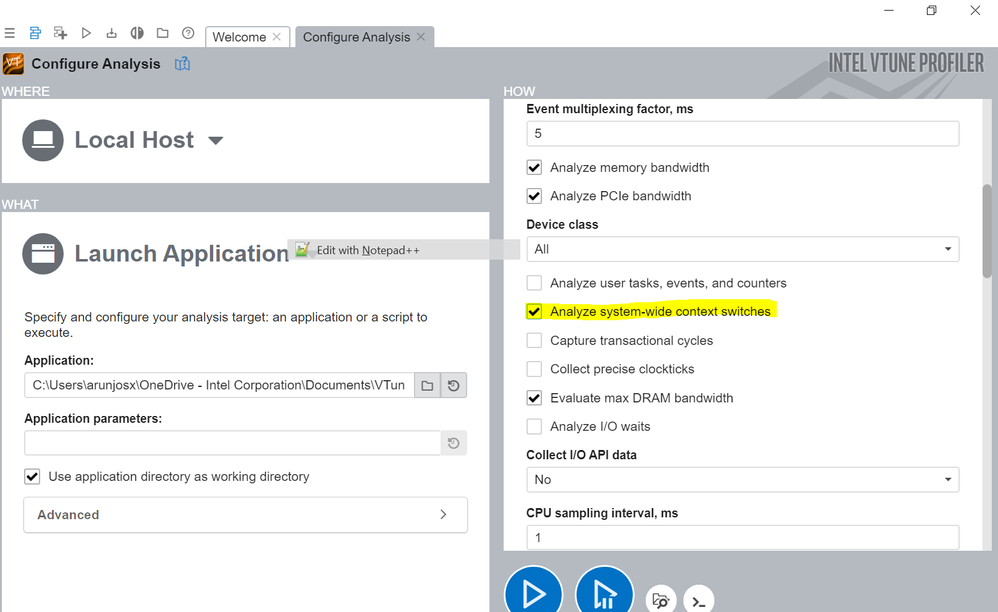
An edit/update to the information I had provided. To visualise cpu/gpu concurrency in latest vesions of vtune. You must do some additional configuration. Please find below the steps
1- Launch VTune as admin(some options do not show up if vtune is not launched with admin privilege)
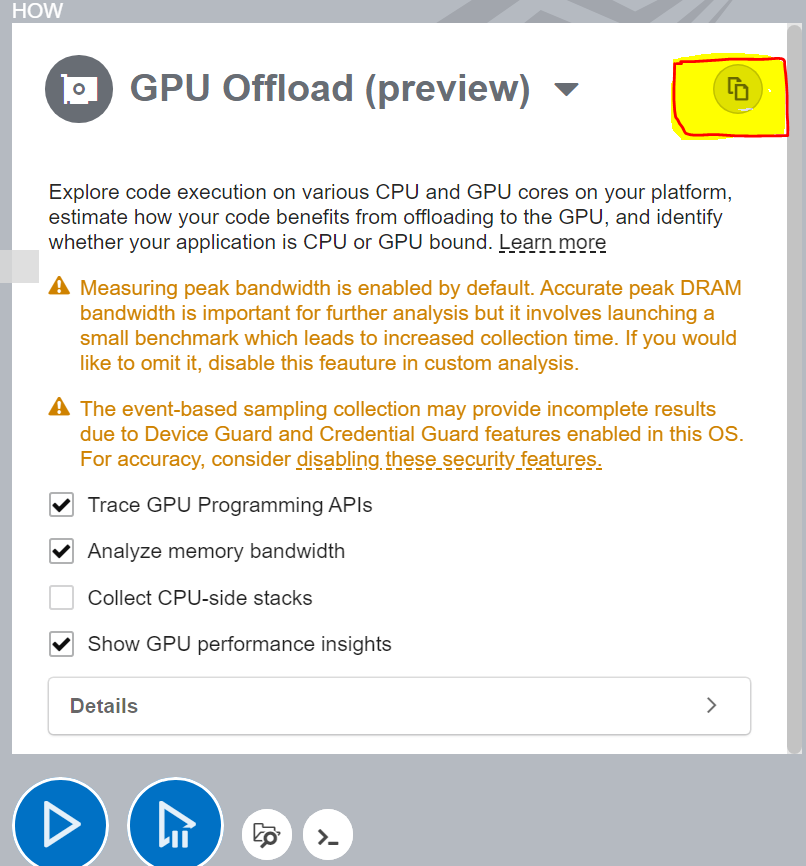
2- Create a custom copy of GPU offload analysis with advanced options of How pane.(To create custom copy, you just need to click the highlighted button in below snap)
3- Check analyse system wide context switches option
Let us know if you would prefer this graph being collected without creating a custom copy. We would be happy to take this forward with engineering as a feedback from your side.
- Mark as New
- Bookmark
- Subscribe
- Mute
- Subscribe to RSS Feed
- Permalink
- Report Inappropriate Content
Hey RN1,
Have you tried out the solution provided to obtain cpu/gpu concurrency plot. Could you please confirm whether the solution provided helps.
Thanks
Arun
- Mark as New
- Bookmark
- Subscribe
- Mute
- Subscribe to RSS Feed
- Permalink
- Report Inappropriate Content
Hi,
We are assuming the solution provided resolves your issue as we have not heard back from you for sometime. We wouldn't be monitoring this thread anymore. Please feel free to raise a new thread in case of further issues.
Arun
- Subscribe to RSS Feed
- Mark Topic as New
- Mark Topic as Read
- Float this Topic for Current User
- Bookmark
- Subscribe
- Printer Friendly Page


