- Mark as New
- Bookmark
- Subscribe
- Mute
- Subscribe to RSS Feed
- Permalink
- Report Inappropriate Content
Hi,
I'm collecting hotspots on SUSE 11.3 with the following command:
amplxe-cl -collect hotspots -duration 200 -run-pass-thru=--no-altstack -result-dir /cores/results/socket_sleep_0 -target-process nsfw-1-2-3 --search-dir sym:r=/cores/gglibc/
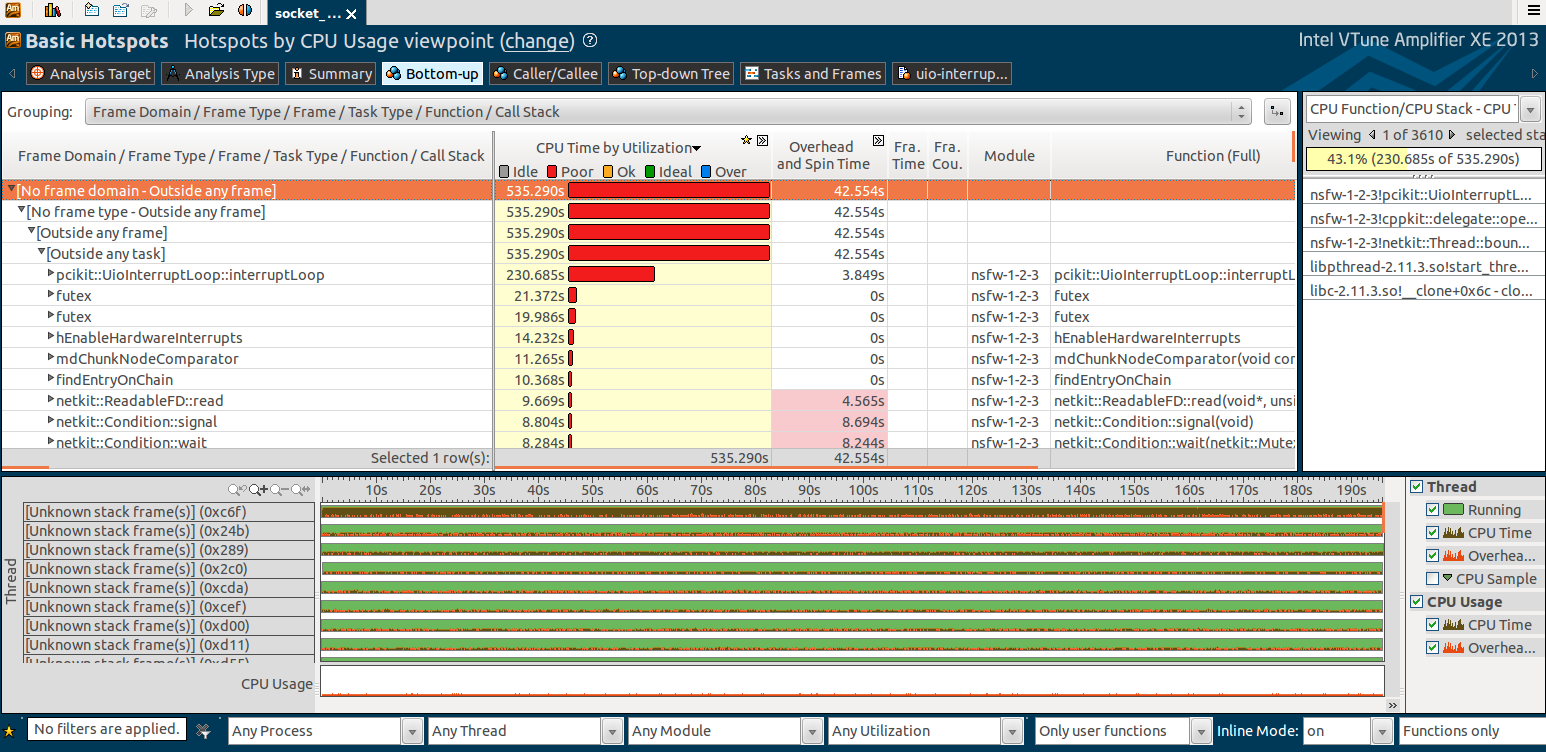
Then I copy the results to Ubuntu machine and open the results with the VTune GUI. The problem is that I don't see the threads at the bottom of the screen. I also don't see any frame information. I do see the functions and the code. Please see the attached screenshot.
Also, Why do I see two modules: nsfw1-2-3 and libpthread-2-11-3.so if I was collecting only one process? Sometimes I see even three modules.
Thanks,
Arik
Link Copied
- Mark as New
- Bookmark
- Subscribe
- Mute
- Subscribe to RSS Feed
- Permalink
- Report Inappropriate Content
Hi Arik:
Shared objects (.so's, e.g., libpthread-2-11-3.so) are loaded by a process, so you should expect to see shared objects loaded by your app.
BTW, your screenshot did not get uploaded. Did you "attach" it?
- Mark as New
- Bookmark
- Subscribe
- Mute
- Subscribe to RSS Feed
- Permalink
- Report Inappropriate Content
- Mark as New
- Bookmark
- Subscribe
- Mute
- Subscribe to RSS Feed
- Permalink
- Report Inappropriate Content
Okay, "frames" only apples if you've instrumented your code with our API, or for the Intel OpenMP runtime. Have you done that, or are you using Intel's OpenMP runtime?
Otherwise, just use the one of the non-frame groupings, such as Function / Callstacks.
Was the original command line generated by the graphical user interface? I'm trying to understand why the "-run-pass-thru=--no-altstack"?
- Mark as New
- Bookmark
- Subscribe
- Mute
- Subscribe to RSS Feed
- Permalink
- Report Inappropriate Content
Regarding the OpenMP - this is a good question, I' new to this code and I haven't figured this out yet.
I haven't used the GUI to generate the command. The reason I have added it, is because without it I get the following error:
amplxe: Error: Stack size provided to sigaltstack is too small. Please increase the stack size to 64K minimum.
Hundreds of it...
Thanks,
Arik
- Mark as New
- Bookmark
- Subscribe
- Mute
- Subscribe to RSS Feed
- Permalink
- Report Inappropriate Content
Well, I suspect that is why you are seeing "unknown stack" in your results. Also, you are attaching to a running process. What kind of a process is it? Does it have any security attributes? Is it running as a service or something like that? Is there any way you can have VTune Amplifier XE launch the app instead of attaching?
Regarding viewing results, you won't see any frames, so don't try to use that Grouping.
- Mark as New
- Bookmark
- Subscribe
- Mute
- Subscribe to RSS Feed
- Permalink
- Report Inappropriate Content
It doesn't have any security attributes. Sometimes I attach to a service and sometimes as a regular process. In the attached screenshot this is a regular process. I'm not sure I can have VTune to launch it - I need to explore this option. But for now, let's say I can't. Is there something else I can do?
- Mark as New
- Bookmark
- Subscribe
- Mute
- Subscribe to RSS Feed
- Permalink
- Report Inappropriate Content
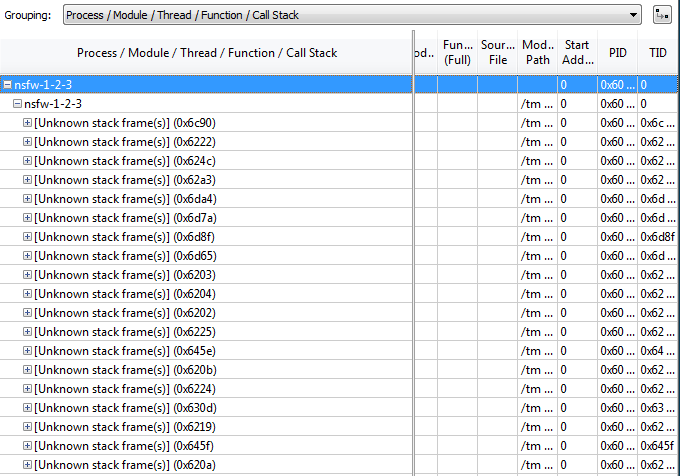
well, so tell me what it is you are trying to accomplish? You want to profile your application, which is already running and you want to find the hotspots? It appears that there is some information (in the ubuntu_0 image), since the callstack pane on the right shows the calls from pthreads to your app. What happens if you expand the nsfw node in the grid? (Ignore the timeline for now).
- Mark as New
- Bookmark
- Subscribe
- Mute
- Subscribe to RSS Feed
- Permalink
- Report Inappropriate Content
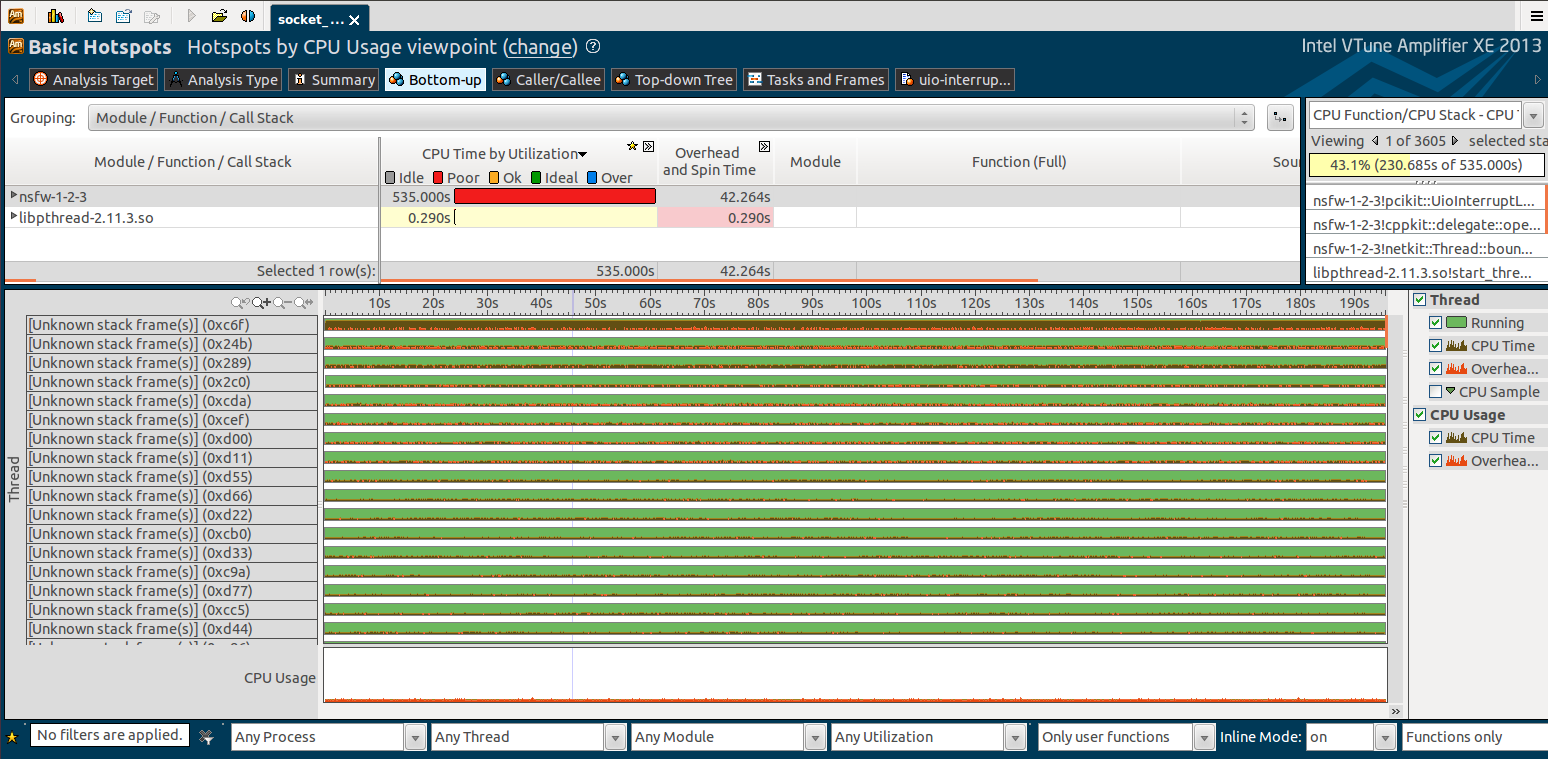
Yes - I'm trying to find hotspots in an application that is already running. There is a lot of info there - I can see all the functions, the files, the call stack... I'm attaching a new image.
I'm also trying to see some info on the threads, but I see is the [Unknown stack] and thread_create_bounce.
BTW - what thread_create_bounce means?
Thanks,
Arik
- Mark as New
- Bookmark
- Subscribe
- Mute
- Subscribe to RSS Feed
- Permalink
- Report Inappropriate Content
What information about threads are you interested in? What are you trying to understand about the threading?
thread_create_bounce is the name of the thread. The code that is creating the thread is providing a name at creation and VTune Amplifier XE is able to display that name.
What kind of application is this? It appears that it is waiting around for interrupts, so it is not doing much of anything. In that case, it may be useful to instrument your code with the Pause/Resume API and only collect data during "processing." Of course, it depends on what you are trying to tune. I am making the assumption that you are attempting to tune code performance. Also, if you add the APIs, you will have to have VTune Amplifier XE launch your application. The APIs do not work when attaching to a running process (because when the application is started outside of Amplifier XE, stubs are linked in and they cannot be replaced/relinked when Amplifier XE attaches).
For more analysis of your threads, please use the "Locks and Waits" analysis type.
- Mark as New
- Bookmark
- Subscribe
- Mute
- Subscribe to RSS Feed
- Permalink
- Report Inappropriate Content
At this point the info that I need is the names of the threads. I can learn a lot from this grouping, but it's pretty annoying to look it it without thread names.
Our application is kind of file server, which receives files from a socket (this is the place where the application waits a lot of time) and writes them somewhere else.
Also, I'm not sure I got the exact reason for the missing names - is it instrumentation problem (attaching vs. running from inside VTune), the absence of OpenMP runtime or the fact I have used -run-pass-thru=--no-altstack flag ?
The first one - I'm trying to understand this as we speak.
The send one - we are not using OpenMP, so can't to much about it
The third one - is there any way to bypass it?
Thanks,
Arik
- Mark as New
- Bookmark
- Subscribe
- Mute
- Subscribe to RSS Feed
- Permalink
- Report Inappropriate Content
Hi Arik:
It may be helpful for you to build the sample application included with the product, tachyon, and run some collections to see what the results *should* look like. I don't know *what* that -no-altstack option is doing to your results!! But, the attaching may be limiting what you collect as well. Thus my suggestion to try the sample. If everything looks fine with the sample, then you know it is your application that affecting collection and not a system issue.
Also, you *are* building with debug systems enabled, correct? That is, the '-g' option on the compiler and you are *not* stripping the binary?
Regarding thread naming, normally it is the name of the function being passed to pthread create plus the OS thread ID.
- Subscribe to RSS Feed
- Mark Topic as New
- Mark Topic as Read
- Float this Topic for Current User
- Bookmark
- Subscribe
- Printer Friendly Page