- Mark as New
- Bookmark
- Subscribe
- Mute
- Subscribe to RSS Feed
- Permalink
- Report Inappropriate Content
Hi,
I'm working on a code that i already optimized. After a first optimization i did a Hotspots and Lightweight Hotspots analysis (screen print ==> Hotspots&LightweightHotspots.png). I see CPU utilization is very poor for the slower functions. I think is due to memory acces so i run a general exploration, memory acces analysis (look attache files). I launched a branch analysis because there are several "if" inside loops.
But now i don't how to interprate theses data and extract others informations.
can someone axplain me the next steps?
thanks,
Link Copied
- Mark as New
- Bookmark
- Subscribe
- Mute
- Subscribe to RSS Feed
- Permalink
- Report Inappropriate Content
OK. Let me to interpret these data:
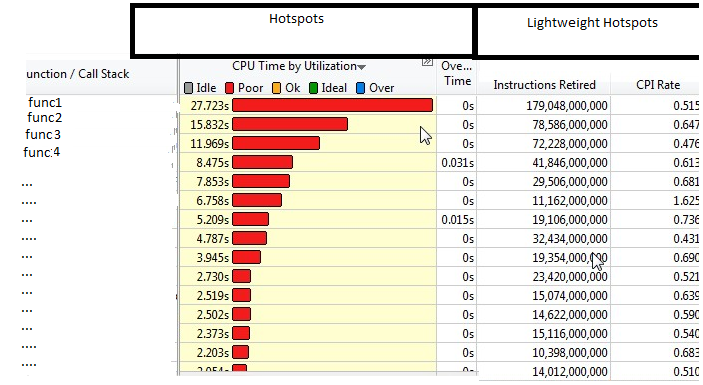
1. Results in Hotspot & LightweightHotspots: func1..func4 consumed CPU time but probably other CPU cores were not active for some reason, we said "Poor" was on parallelism.
2. Results in memory access analysis: L2/LLC miss count is not high compared with LOAD/STORE counts, L1 Hit rate is high - good performance in microarchitecture.
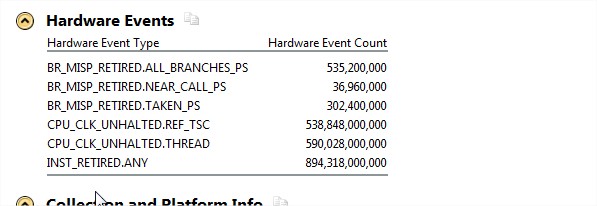
3. Misprediction is 535,200,000, based on your used event name - you work on 2nd generation core processor. Penalty is 20 cycles for each branch misprediction, so delay is 1,070,400,000. however total CPU clocks are 590,000,000,000 during data collecting, Impact of Branch Misprediction is 1,070,400,000/590,000,000,000 < 0.2% . So it impacts on performance low.
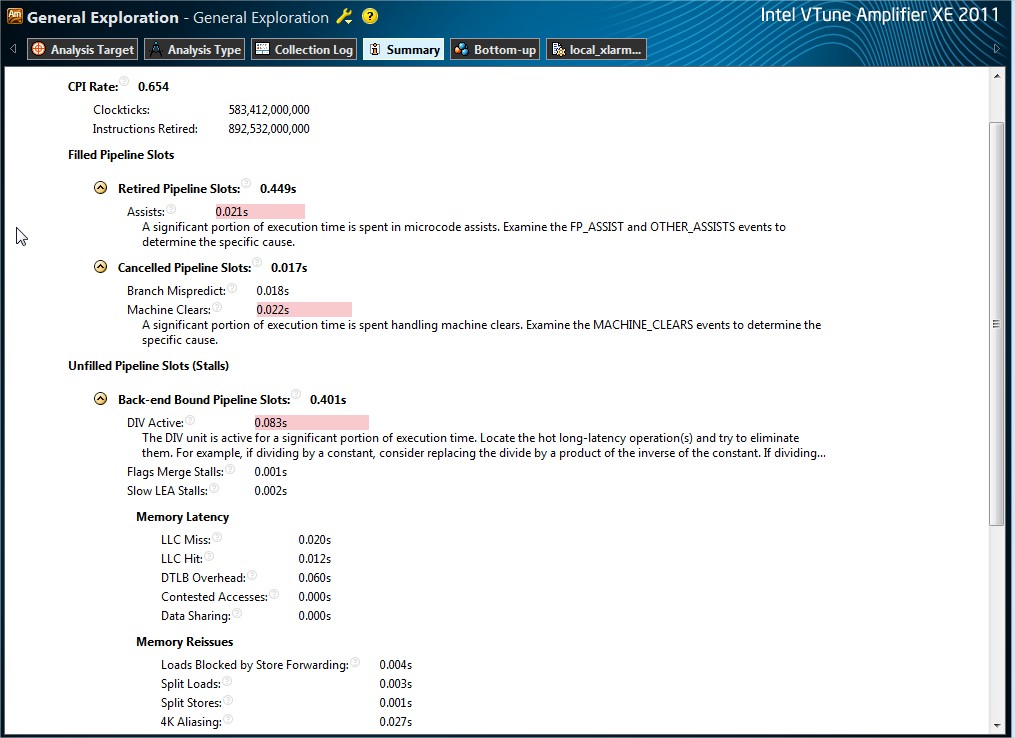
4. Your GE analysis result proved point 3, Branch Mispredict was not highlighted, Machine Clear was highlighted - you may go bottom-up report to review associated function/source and investigate why.
- Mark as New
- Bookmark
- Subscribe
- Mute
- Subscribe to RSS Feed
- Permalink
- Report Inappropriate Content
Hi,
Thanks for your post.
i made some analisis but i can't find the causes of MACHINE_CLEARS and i have not always understood the causes of this signal.
I have questions about VTune and Optimization :
VTune take the performance of current code but if i redesign the code, i probably a different result. So Can i conclude thanks to VTune analysis if i have a good design for computations ?
Can i observe the flops of my code?
I Think for more performance i must redesign the code. Currently the data are stocked in Matrix/Vectors. Each MAtrix/Vector is an attribute of a class. I can regroup data in Cubes/Vectors, which will be attribute of a general Class, and rewrite the algorithme in order to have loops closest of the calculations (for more parallelism/simd) and decrease the virtual function calls.
I'm wrong?
- Mark as New
- Bookmark
- Subscribe
- Mute
- Subscribe to RSS Feed
- Permalink
- Report Inappropriate Content
If you will redesign your code and its machine code representation will be different then the analysis can be different.Regarding floating point instructions retired they are tracked by specific counter and displayed by VTune.
- Subscribe to RSS Feed
- Mark Topic as New
- Mark Topic as Read
- Float this Topic for Current User
- Bookmark
- Subscribe
- Printer Friendly Page