- Mark as New
- Bookmark
- Subscribe
- Mute
- Subscribe to RSS Feed
- Permalink
- Report Inappropriate Content
Hi All,
I am trying to use Intel VTUNE 2016 v2 for analyzing a simple java program using the general exploration mode. The Java program is as follows:-
public class SimpleEx {

public static void main(String[] args) {

for (int i = 0; i < 10; i++) {

System.out.println("Hello World");

}

}

}
I compile the above code as "javac -g SimpleEx". I use JDK v1.7
I have created a run.sh script which has one line"java SimpleEx"
I am using the GUI version by invoking ./amplxe-gui. Under the "Analysis Target tab", I select the application as run.sh. I select "Managed code profiling mode" as native and tick "analyze child processes". Then I select General Exploration analysis
After the analysis completes, none of the top-down or bottom-up stacks refer to the SimpleEx class or the main function. Most references look like "func@0x3c1222" etc.
What am I missing here? How to enable profiling of this java application? Appreciate any help in this regard.
Thanks
Rene
- Mark as New
- Bookmark
- Subscribe
- Mute
- Subscribe to RSS Feed
- Permalink
- Report Inappropriate Content
> I tried using the Function/call stack option as you suggested. But the call stack I get still looks broken,
probably you used java version from the system to build, but I used other.
# /home/peter/jdk1.7.0_11/bin/java -version
java version "1.7.0_11"
Java(TM) SE Runtime Environment (build 1.7.0_11-b21)
Java HotSpot(TM) 64-Bit Server VM (build 23.6-b04, mixed mode)
# java -version
java version "1.6.0_22"
OpenJDK Runtime Environment (IcedTea6 1.10.4) (rhel-1.41.1.10.4.el6-x86_64)
OpenJDK 64-Bit Server VM (build 20.0-b11, mixed mode)
Link Copied
- Mark as New
- Bookmark
- Subscribe
- Mute
- Subscribe to RSS Feed
- Permalink
- Report Inappropriate Content
I don't know what is environment variable for Java_Home you specified, but what Java version to build then what Java version to run.
# ../jdk1.7.0_11/bin/javac -g SimpleEx.java
# amplxe-cl -c hotspots -- ../jdk1.7.0_11/bin/java SimpleEx
In order to capture more samples in output stream, you may increase iteration from "10" to "10000"
[root@prc-mic01 tmp]# amplxe-cl -R hotspots | more
amplxe: Using result path `/home/peter/tmp/r050hs'
amplxe: Executing actions 75 % Generating a report Function CPU Time CPU Time:Effective Time CPU
Time:Effective Time:Idle CPU Time:Effective Time:Poor CPU Time:Effective Time
:Ok CPU Time:Effective Time:Ideal CPU Time:Effective Time:Over CPU Time:Spin
Time CPU Time:Overhead Time Module Function (Full)
Source File Start Address
---------------------------------------- -------- ----------------------- ---
------------------------- ---------------------------- -----------------------
--- ----------------------------- ---------------------------- --------------
---- ---------------------- --------------- ---------------------------------
------------------------------------ ----------- --------------
Interpreter 0.070s 0.070s
0.010s 0.060s
0s 0s 0s
0s 0s [Dynamic code] Interpreter
[Unknown] 0x7fafb1005460
dlopen 0.060s 0.060s
0s 0.060s
0s 0s 0s
0s 0s libdl.so.2 dlopen
[Unknown] 0x3943c00eb0
Java_java_io_FileOutputStream_writeBytes 0.050s 0.050s
0s 0.050s
0s 0s 0s
0s 0s libjava.so Java_java_io_FileOutputStream_wri
teBytes [Unknown] 0xe820
Matcher::xform 0.020s 0.020s
0s 0.020s
0s 0s 0s
0s 0s libjvm.so Matcher::xform(Node*, int)
[Unknown] 0x6b6750
- Mark as New
- Bookmark
- Subscribe
- Mute
- Subscribe to RSS Feed
- Permalink
- Report Inappropriate Content
Hi Peter,
Thanks a lot for your reply.
The hotpot analysis result does not have any reference to the main function (of the SimpleEx class). Is it being referred to by the "Dynamic code" section of the result.
Eventually, I would like to use VTUNE for analyzing java programs with larger (more) functions/classes and identify hotspot functions/modules, call stack information and perform the new general exploration analysis on the hot functions. How can I do the same i.e, see function/module names of the associated java program instances in the vtune analysis result?
Thanks again for your help.
Best Regards,
Rene
- Mark as New
- Bookmark
- Subscribe
- Mute
- Subscribe to RSS Feed
- Permalink
- Report Inappropriate Content

- Mark as New
- Bookmark
- Subscribe
- Mute
- Subscribe to RSS Feed
- Permalink
- Report Inappropriate Content
Hi Peter,
Thanks again for your reply.
I followed the instructions you provided.
1. downloaded the test.java file
2. Compiled using /usr/lib/jvm/java-7-openjdk-amd64/bin/javac -g test.java
3. Ran vtune general exploration using "amplxe-cl -c general-exploration -knob enable-stack-collection=true -d 10 -- /usr/lib/jvm/java-7-openjdk-amd64/bin/java test"
4. Using gui to analyze results :- amplxe-gui r000ge/
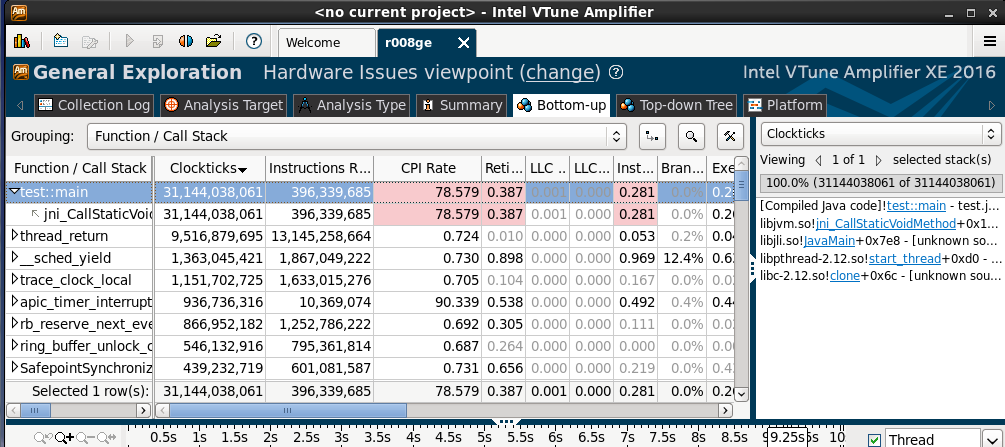
I can see the main function in the call stack now (thanks for the tips), but the call-stack is still broken - the screenshot is attached herewith. It is different from the call stack that you posted before, I am not sure what I am missing here. Can you please help me identify the issue?501971501972
I am also attaching vtune amplxe-cl output here for your reference.
Thanks a lot for your help.
Best Regards,
Rene
- Mark as New
- Bookmark
- Subscribe
- Mute
- Subscribe to RSS Feed
- Permalink
- Report Inappropriate Content
Hi,
I am not sure why vtune cannot resolve following dependencies:-
amplxe: Warning: Cannot locate debugging symbols for file `/opt/intel/vtune_amplifier_xe_2016.2.0.444464/lib64/runtime/libamplxe_samplingmrte_javaprof_1.0.so'.
amplxe: Warning: Cannot locate debugging symbols for file `/usr/lib/jvm/java-7-openjdk-amd64/jre/lib/amd64/libjava.so'.
amplxe: Warning: Cannot locate debugging symbols for file `/lib/x86_64-linux-gnu/libz.so.1.2.8'.
amplxe: Executing actions 23 % Resolving information for `libjli.so'
amplxe: Warning: Cannot locate debugging symbols for file `/usr/lib/jvm/java-7-openjdk-amd64/jre/lib/amd64/jli/libjli.so'.
amplxe: Executing actions 23 % Resolving information for `libc-2.19.so'
amplxe: Warning: Cannot locate file `vtsspp.ko'.
amplxe: Warning: Cannot locate file `/usr/lib/debug/lib/modules/3.19.0-49-generic/vmlinux'.
amplxe: Executing actions 24 % Resolving information for `[Dynamic code]'
amplxe: Warning: Cannot locate debugging symbols for file `/usr/lib/jvm/java-7-openjdk-amd64/jre/lib/amd64/server/libjvm.so'.
amplxe: Executing actions 24 % Resolving information for `libzip.so'
amplxe: Warning: Cannot locate debugging symbols for file `/usr/lib/jvm/java-7-openjdk-amd64/jre/lib/amd64/libzip.so'.
amplxe: Executing actions 24 % Resolving information for dangling locations
amplxe: Warning: Cannot locate file `wl.ko'.
amplxe: Executing actions 28 % Resolving call target names for dynamic code
amplxe: Warning: Cannot locate debugging symbols for file `/usr/lib/jvm/java-7-openjdk-amd64/jre/lib/amd64/server/libjvm.so'.
amplxe: Executing actions 75 % Generating a report
Can the broken call stack be because of this?
My JAVA version, java -version
java version "1.7.0_95"
OpenJDK Runtime Environment (IcedTea 2.6.4) (7u95-2.6.4-0ubuntu0.14.04.2)
OpenJDK 64-Bit Server VM (build 24.95-b01, mixed mode)
Thanks,
Rene
- Mark as New
- Bookmark
- Subscribe
- Mute
- Subscribe to RSS Feed
- Permalink
- Report Inappropriate Content
My grouping was "Function \ Call Stack", you used "Source Function / Function / Call Stack" grouping.
It should be:
Test::main
Test:: main
jni_CallStaticVoidMethod<-JavaMain<-start_thread
Other: their is no debug info for some modules when finalizing data, VTune will display function as [Function+offset] or [Module] format, please ignore them.
- Mark as New
- Bookmark
- Subscribe
- Mute
- Subscribe to RSS Feed
- Permalink
- Report Inappropriate Content
Hi Peter,
Thanks for your reply.
I tried using the Function/call stack option as you suggested. But the call stack I get still looks broken, not same as what you had posted before (attached is a snapshot). I am not able to understand why the output is different/broken?
Thanks,
Rene
- Mark as New
- Bookmark
- Subscribe
- Mute
- Subscribe to RSS Feed
- Permalink
- Report Inappropriate Content
> I tried using the Function/call stack option as you suggested. But the call stack I get still looks broken,
probably you used java version from the system to build, but I used other.
# /home/peter/jdk1.7.0_11/bin/java -version
java version "1.7.0_11"
Java(TM) SE Runtime Environment (build 1.7.0_11-b21)
Java HotSpot(TM) 64-Bit Server VM (build 23.6-b04, mixed mode)
# java -version
java version "1.6.0_22"
OpenJDK Runtime Environment (IcedTea6 1.10.4) (rhel-1.41.1.10.4.el6-x86_64)
OpenJDK 64-Bit Server VM (build 20.0-b11, mixed mode)
- Mark as New
- Bookmark
- Subscribe
- Mute
- Subscribe to RSS Feed
- Permalink
- Report Inappropriate Content
Hi Peter,
Yes, you are right. I downloaded the Java Hotspot v1.8 JDK. I compiled/ran the test program again with the hotspot JDK. Now the call stack includes some missing functions (callstack snapshot attached herewith).
Thanks a lot for your help.
Best Regards,
Rene
- Mark as New
- Bookmark
- Subscribe
- Mute
- Subscribe to RSS Feed
- Permalink
- Report Inappropriate Content
- Mark as New
- Bookmark
- Subscribe
- Mute
- Subscribe to RSS Feed
- Permalink
- Report Inappropriate Content
Vtune profiles Java methods which were JITed. It does not recognize methods which are interpreted by JVM (those which are not hot, usually main function).
See Java support limitations section in our docs - https://software.intel.com/en-us/node/544058#GUID-41CC895F-7E4F-47C6-8872-332C10E234A2
- Subscribe to RSS Feed
- Mark Topic as New
- Mark Topic as Read
- Float this Topic for Current User
- Bookmark
- Subscribe
- Printer Friendly Page