- Mark as New
- Bookmark
- Subscribe
- Mute
- Subscribe to RSS Feed
- Permalink
- Report Inappropriate Content
Hi There,
I am using Intel's VTune Amplifier XE 2016 integrated in Visual Studio 2015 to do hotspot analysis. Can anybody tell me how to analyse an MPI application?
What I did is as follows.
In the "Application" field of the Amplifier Project Properties, add "C:\Program Files (x86)\IntelSWTools\mpi\5.1.2.146\intel64\bin\mpiexec.exe"
in the "Application parameters" field of the Amplifier Project Properties, add "-n 4 C:\Users\wang.j\VS2015\C30\C30\x64\Release\C30.exe"
However, on launching the analysis it almost instantly aborts, so quick that I cannot see ant error message.
There is no problem for serial code analysis. When the "Application" field is filled with "C:\Users\wang.j\VS2015\C30\C30\x64\Release\C30.exe" and the "Application parameters" field empty, the analysis runs without problems.
can anyone help, please?
Link Copied
- Mark as New
- Bookmark
- Subscribe
- Mute
- Subscribe to RSS Feed
- Permalink
- Report Inappropriate Content
Just to update.
By setting up a completely new project, I can now run Hotspot analysis of an MPI application (4 threads). However, the Top Hotspots section shows the top function "func@0x1400528a0", which is not one of my functions in my Fortran code. What I really need is to find the hotspot in my code.
- Mark as New
- Bookmark
- Subscribe
- Mute
- Subscribe to RSS Feed
- Permalink
- Report Inappropriate Content
Hello,
Could you please go to bottom up pane and see the full list there - do you see your functions there?
Also there you can see "Module" column - could you please recognize the modules of the functions like "func@0x1400528a0"?
Thanks & Regards, Dmitry
- Mark as New
- Bookmark
- Subscribe
- Mute
- Subscribe to RSS Feed
- Permalink
- Report Inappropriate Content
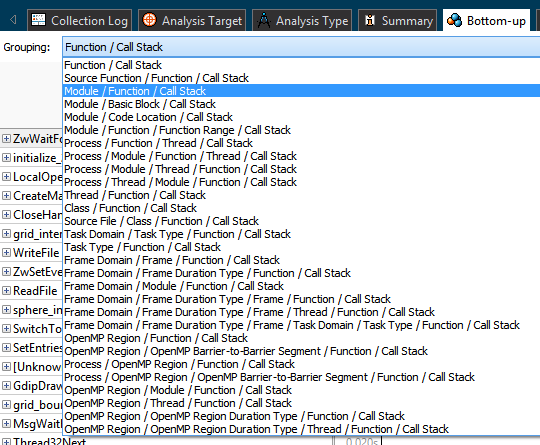
You can also use the "Grouping" to change the order to "Module \ Function \ Call stack" and then just look at the functions in your code:
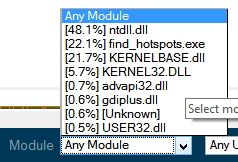
Or, use the Module list at the bottom to filter out all other modules:
- Mark as New
- Bookmark
- Subscribe
- Mute
- Subscribe to RSS Feed
- Permalink
- Report Inappropriate Content
Did you use compiler's option "/Zi" and generated PDB file? PDB file was stored in same directory of EXE/DLL? If not, you have to re-resolve result with setting search-dir.
- Mark as New
- Bookmark
- Subscribe
- Mute
- Subscribe to RSS Feed
- Permalink
- Report Inappropriate Content
Hi Dmitry, MrAnderson, and Peter,
Thank you all very much for the kind suggestions. With exactly the same project, the hotspot analysis is OK (i.e. I can see the hotspot functions in my code) when no MPI is used (When the "Application" field in Amplifier Project Properties is filled with "C:\Users\wang.j\VS2015\C30\C30\x64\Release\C30.exe" and the "Application parameters" field is empty). However, the module c30.exe (and any of its functions) is NOT shown in hotspot analysis results when MPI is used (When the "Application" field of the Amplifier Project Properties is filled with "C:\Program Files (x86)\IntelSWTools\mpi\5.1.2.146\intel64\bin\mpiexec.exe", and the "Application parameters" field is filled with "-n 4 C:\Users\wang.j\VS2015\C30\C30\x64\Release\C30.exe"). The Bottom-up pane looks like
- Mark as New
- Bookmark
- Subscribe
- Mute
- Subscribe to RSS Feed
- Permalink
- Report Inappropriate Content
Hi jinliang:
I'm sorry, I was only replying to the question you asked in your second post. Now that I review your original post, I see that you have things backwards. That is, you need to have MPI launch VTune Amplifier. What you are getting now is a profile of mpiexec because that is what you told VTune Amplifier to launch. Please see the documentation, which clear describes how to profile MPI applications.
- Mark as New
- Bookmark
- Subscribe
- Mute
- Subscribe to RSS Feed
- Permalink
- Report Inappropriate Content
Hi MrAnderson,
Thanks for the insight. However, I cannot find how to MPI launch VTune Amplifier in Visual Studio. The document is about launching MPI VTune Amplifier in Linux (or DOS prompt?).
Jinliang
- Mark as New
- Bookmark
- Subscribe
- Mute
- Subscribe to RSS Feed
- Permalink
- Report Inappropriate Content
@Jinliang
I have a blog about using VTune with MPI application on Linux*. You might use same command line (in cmd) on Windows*. You may see my latest *note* about using new syntax (old command still can be used for now - I mean "-gtool" option).
- Mark as New
- Bookmark
- Subscribe
- Mute
- Subscribe to RSS Feed
- Permalink
- Report Inappropriate Content
Hi Peter,
Thank you very much for the advice! So there is no way of launching a hotspot analysis of my code in an MPI application in Visual Studio, right?
Jinliang
- Mark as New
- Bookmark
- Subscribe
- Mute
- Subscribe to RSS Feed
- Permalink
- Report Inappropriate Content
Hello Jinliang,
The main problem why you see only mpiexec module profiling from VS is that in the case of mpiexec as a launch process VTune cannot track follow child processes spawned by mpi launcher.
You can try the following to have the launch from Visual Studio:
Use advanced hotspot analysis type and in project properties check "Analyze system" knob. In this case you will have system wide collection limited by mpiexec live time. So it should pick up your ranks. One limitation that you will have with this approach is if you use OpenMP - you will not have OpenMP analysis section that is based on instrumentation that will not be switched on.
Thanks & Regards, Dmitry
- Mark as New
- Bookmark
- Subscribe
- Mute
- Subscribe to RSS Feed
- Permalink
- Report Inappropriate Content
Hi Dmitry,
Thank you very much for the advice. However, the only "Analysis system" knob I can found is in the "Analysis Target" page of Amplifier Project Properties. It is actually called "Analyze system-wide". However, when I checked it, there comes an error message "This analysis type does not support system-wide profiling. Please specify an application to launch or process to attach to".
Jinliang
- Mark as New
- Bookmark
- Subscribe
- Mute
- Subscribe to RSS Feed
- Permalink
- Report Inappropriate Content
Hello Jinliang,
Please switch Analysis type to "Advanced Hotspots"
Regards, Katya
- Mark as New
- Bookmark
- Subscribe
- Mute
- Subscribe to RSS Feed
- Permalink
- Report Inappropriate Content
Hi Dmitry and Katya,
Thank you very much for the advice and patience! It works now!
With best wishes,
Jinliang
- Subscribe to RSS Feed
- Mark Topic as New
- Mark Topic as Read
- Float this Topic for Current User
- Bookmark
- Subscribe
- Printer Friendly Page

