- Mark as New
- Bookmark
- Subscribe
- Mute
- Subscribe to RSS Feed
- Permalink
- Report Inappropriate Content
I am using Amplifier XE 2013 (with Update 2), but I have trouble finding bottlenecks that are caused by excessive wait times due to calls to WaitNamedPipe().
I have tried the analysis types "Hotspots" and "Locks and Waits", but none of these work; they always display 0 seconds for WaitNamedPipe(), even though that function caused more than 50 seconds in some of my programs.
What needs to be configured in Amplifier XE in order to properly analyze programs that use WaitNamedPipe()? Or is this a bug in the current Amplifier XE version?
Link Copied
14 Replies
- Mark as New
- Bookmark
- Subscribe
- Mute
- Subscribe to RSS Feed
- Permalink
- Report Inappropriate Content
WaitNamedPipe() may call kernel functions in system dll, and self time of WaitNamedPipe() is less.
My opinion is to view bottom-up report by changing Call Stack Mode as "User/system functions", then view hot functions which might has parent named WaitNamedPipe(), or see top-down tree report to find WaitNamedPipe().
- Mark as New
- Bookmark
- Subscribe
- Mute
- Subscribe to RSS Feed
- Permalink
- Report Inappropriate Content
Hi Peter,
Amplifier XE does not mention WaitNamedPipe() anywhere in the top-down tree or bottom-up tree. Even if I use NumPad-* to expand the whole top-down tree and search for WaitNamedPipe using "Find", nothing is found.
- Mark as New
- Bookmark
- Subscribe
- Mute
- Subscribe to RSS Feed
- Permalink
- Report Inappropriate Content
Have you changed call stack mode?
Are you sure that WaitNamePipe() consumes CPU time, or its subroutines? You can use lightweight-hotspots to verify.
Would you mind to attach result directory, so I have a look inside?
- Mark as New
- Bookmark
- Subscribe
- Mute
- Subscribe to RSS Feed
- Permalink
- Report Inappropriate Content
- Mark as New
- Bookmark
- Subscribe
- Mute
- Subscribe to RSS Feed
- Permalink
- Report Inappropriate Content
Thanks for result files.
Usually using Pipe communication includes two portions: Server end, and Client end.
From Server end, using CreateNamedPipe() to create Pipe named instance, then listen the connection requst from Client end by using ConnectNamedPipe() and do communication; From Client end, use WaitNamedPipe() to connect specific Pipe by using pipe name to get connection before timeout, then call CreateFile() to do data Read/Write.
In this way, I assume that you worked on client-end, and WaitNamedPipe() was executed quickly (WaitNamedPipe() is in kernel32.dll). Opening your result file, change Call Stack Mode: User/system functions.
1. You cannot find WaitNamedPipe() in Sync Object - because it connected to the server quickly.
2. However you still can see "RPC client" (which used the pipe to execute remote procedure? ) from locksandwaits report. Its wait time is 0.001s - which doesn't block your program's running.
3. Change the report to Hotspots by clicking on "the tool icon" then select Hotspots, you will see most time was consumed in WaitForSingleObject, NtWaitFor SingleObject, and WaitForMultipleObjectsEx - which are from kernel32.dll or ntdll.dll
4. You also can find NtCreateFile() in list but only 9.99ms, but there is no WaitNamedPipe() you expected - it ran so quickly I guess. In general speaking VTune lists hot functions which ran 10ms or above.
So you might run heavy Pipe Communications, 10 times even 100 times handshake - you may see WaitNamedPipe() in list. Does it make sense?
- Mark as New
- Bookmark
- Subscribe
- Mute
- Subscribe to RSS Feed
- Permalink
- Report Inappropriate Content
> In this way, I assume that you worked on client-end, and WaitNamedPipe() was executed quickly ...
Yes, I worked on the client end.
No, WaitNamedPipe() was executed slowly, namely 5000 milliseconds per call.
To illustrate the problem, I have attached a small sample program.
- Compile the attached Visual Studio 2010 SP1 solution
in the Debug mode, Win 32.
- Start the Server.exe.
- Start the Client.exe, using Amplifier XE (in "Locks and Wait" mode).
The Client.exe calls WaitNamedPipe() 15 times; each of these calls blocks for 1000 milliseconds.
Expected result: Amplifier XE shows a wait time of 15000 milliseconds.
Actual result: Amplifier XE shows no wait time of WaitNamedPipe().
- Mark as New
- Bookmark
- Subscribe
- Mute
- Subscribe to RSS Feed
- Permalink
- Report Inappropriate Content
Thanks for your sln - it helps to diagnose the problem.
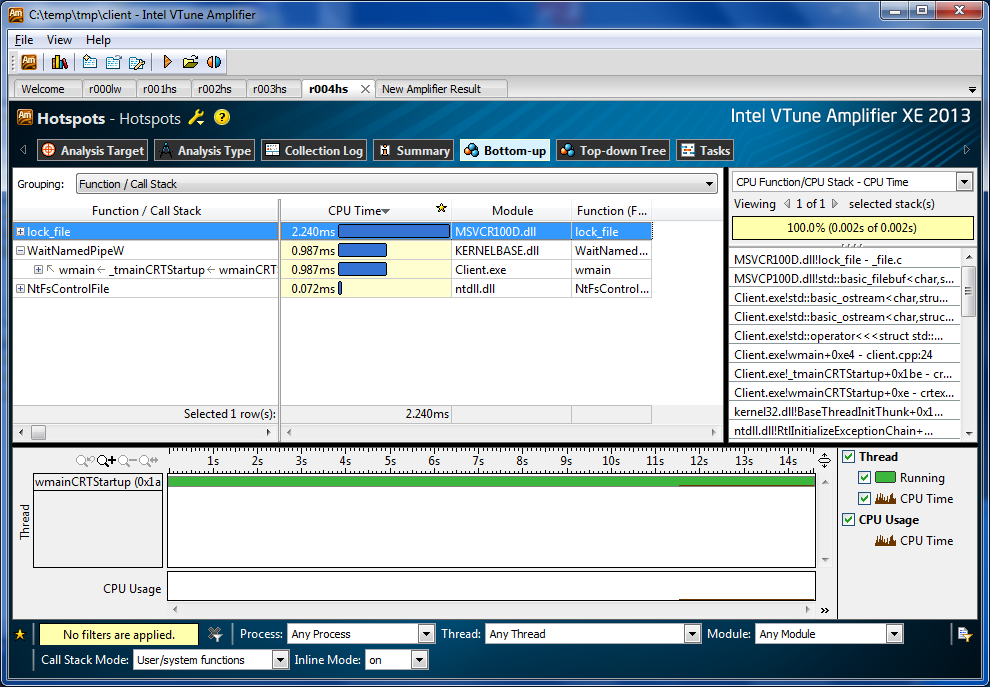
I found that WaitNamePipe() only consumes 0.98ms, so there was empty result after using 10ms sample interval.
Also there are limites waits in client program (except stream object), so I used Hotspots collector but set "CPU sampling interval, ms" - 1 . Please see screen result file named WaitNamePipe.png, attached.
- Mark as New
- Bookmark
- Subscribe
- Mute
- Subscribe to RSS Feed
- Permalink
- Report Inappropriate Content
Your screenshot shows 0.987 ms for WaitNamedPipe(), but this method actually waited 15,000 milliseconds.
Does that mean that this is a bug in Amplifier XE?
- Mark as New
- Bookmark
- Subscribe
- Mute
- Subscribe to RSS Feed
- Permalink
- Report Inappropriate Content
Did you mean ~15s for elapsed time to call 15 times WaitNamedPipe(), actually most of works in Pipe not in CPU. You can see CPU usage is low in bottom-up report, small value in Summary report, Elapse time <> CPU time.
This is not the bug of VTune.Amplifier XE
- Mark as New
- Bookmark
- Subscribe
- Mute
- Subscribe to RSS Feed
- Permalink
- Report Inappropriate Content
So back to my original question: What has to be configured in Amplifier XE such that ~15,000 ms are displayed in the result report for WaitNamedPipe()?
WaitNamedPipe() blocks the current thread, just like ReadFile() or WaitForSingleObject(); the latter two functions appear correctly in the reports if "Locks and Wait" analysis mode is used, but WaitNamedPipe() does not.
WaitNamedPipe() is a standard Win32 API function, so why cannot Amplifier XE handle that function properly?
- Mark as New
- Bookmark
- Subscribe
- Mute
- Subscribe to RSS Feed
- Permalink
- Report Inappropriate Content
WaitNamedPipe() itself doesn't consume CPU time high. Yes, WaitNamedPipe() is the sync object that Amplifier supports, I checked in Amplifier's online helper.
I wonder if it is possible that WaitNamedPipe() didn't found the device in your client code? If
I used NMPWAIT_NOWAIT instead of NMPWAIT_USE_DEFAULT_WAIT, Locksandwaits analyzer had 15 waits in report.
I used NMPWAIT_WAIT_FOREVER instead of NMPWAIT_USE_DEFAULT_WAIT, Locksandwaits analyzer only in death-loop, I should stop it with 1 wait in result.
You might check if you client code can find the pipe by name? If all things were time-out, it meant that WaitNamedPipe() was terminated by the system, so it exited abnormally - Amplifier cannot measure its wait count & wait time correctly.
- Mark as New
- Bookmark
- Subscribe
- Mute
- Subscribe to RSS Feed
- Permalink
- Report Inappropriate Content
Hi Frank,
>>...I have trouble finding bottlenecks that are caused by excessive wait times due to calls to WaitNamedPipe()...
Please try to call to a Win32 API function GetLastError() just right after the call to WaitNamedPipe(...) in order to get extended error information.
>>...Or is this a bug in the current Amplifier XE version?
I wouldn't blame Amplifier XE so far and please add an extra line of code with GetLastError().
Best regards,
Sergey
- Mark as New
- Bookmark
- Subscribe
- Mute
- Subscribe to RSS Feed
- Permalink
- Report Inappropriate Content
Xperf tool could be very helpful in your case.
- Mark as New
- Bookmark
- Subscribe
- Mute
- Subscribe to RSS Feed
- Permalink
- Report Inappropriate Content
I think that in such a case using a multitude of profiling tools and methods is recommended in order to isolate the problem or simply narrow it down.
I will also run your code under user mode windbg and issue !runaway metacommand so you will be given an exact kernel and user mode thread time measurement and very accurate call stack.Going further and implementing full blown kernel and user mode debugging you will be able to look for the culprit in kernel mode space.
Reply
Topic Options
- Subscribe to RSS Feed
- Mark Topic as New
- Mark Topic as Read
- Float this Topic for Current User
- Bookmark
- Subscribe
- Printer Friendly Page