- Mark as New
- Bookmark
- Subscribe
- Mute
- Subscribe to RSS Feed
- Permalink
- Report Inappropriate Content
Dear experts,
My question is about using vtune (Amplifier XE 2016 Update 2 (build 444464)) to profile C++ code on MICs.
I was trying to find the top 5 functions with largest CPU_CLK_UNHALTED values and pinpoint the lines of source code causing the hotspots. When using -g -O0, vtune was able to find the functions' name and display the source, but when switching to -g -O2, apparently I could not find those functions' name any more and, instead of the source code, only the assembly was available. Why?
Is it because the compiler has inlined functions wherever possible and somehow stripped the debug info even if -g is present? Is there a way to show which line of source code the assembly belongs to?
Thanks for any advice.
- Mark as New
- Bookmark
- Subscribe
- Mute
- Subscribe to RSS Feed
- Permalink
- Report Inappropriate Content
It is not expected.
- If you run a native MIC application and have a Linux system, it is possible to use the addr2line Linux utility to check that your application has source line information.
- It would be helpful to check VTune finalization output and see if there are any warnings related to your application.
- try to add the directory where the application binary is located to the binary search paths (-search-dir option in cli) and re-resolve the result.
- Is it reproducible with other MIC applications like 'matrix' from VTune samples? If that is the case, could you attach VTune result directory and the corresponding binary file?
Link Copied
- Mark as New
- Bookmark
- Subscribe
- Mute
- Subscribe to RSS Feed
- Permalink
- Report Inappropriate Content
It is not expected.
- If you run a native MIC application and have a Linux system, it is possible to use the addr2line Linux utility to check that your application has source line information.
- It would be helpful to check VTune finalization output and see if there are any warnings related to your application.
- try to add the directory where the application binary is located to the binary search paths (-search-dir option in cli) and re-resolve the result.
- Is it reproducible with other MIC applications like 'matrix' from VTune samples? If that is the case, could you attach VTune result directory and the corresponding binary file?
- Mark as New
- Bookmark
- Subscribe
- Mute
- Subscribe to RSS Feed
- Permalink
- Report Inappropriate Content
I added binary search paths and the names are now resolved correctly. Thanks.
- Mark as New
- Bookmark
- Subscribe
- Mute
- Subscribe to RSS Feed
- Permalink
- Report Inappropriate Content
I have a follow-up question. I my custom profiling analysis, vtune seems to have ignored some metrics and do not report the values in the Caller/Callee page, although the metrics' name indeed appear in the Analysis Type panel.
L1_DATA_HIT_INFLIGHT_PF1
L2_DATA_READ_MISS_CACHE_FILL
DATA_PAGE_WALK
LONG_DATA_PAGE_WALK
L2_VICTIM_REQ_WITH_DATA
SNP_HITM_L2
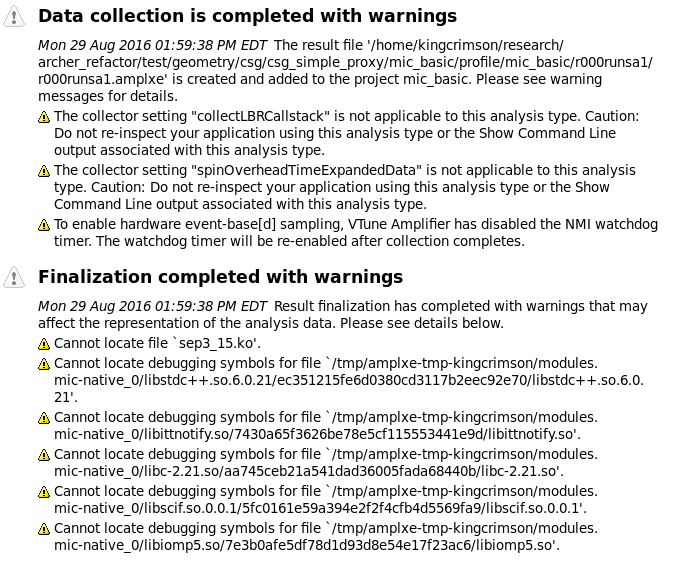
How to solve this issue? Is this related to any of the warnings below, such as the first two pieces?
Thank for your comments.
- Mark as New
- Bookmark
- Subscribe
- Mute
- Subscribe to RSS Feed
- Permalink
- Report Inappropriate Content
Hello,
For custom event analysis by default VTune uses HW Events viewpoint that simply shows event values on summary and grid views including caller/callee. First of all - if you look at summary pane - do you see all the events that you set in hardware events table?
Thanks & Regards, Dmitry
- Subscribe to RSS Feed
- Mark Topic as New
- Mark Topic as Read
- Float this Topic for Current User
- Bookmark
- Subscribe
- Printer Friendly Page
