- Mark as New
- Bookmark
- Subscribe
- Mute
- Subscribe to RSS Feed
- Permalink
- Report Inappropriate Content
Hi All,
I have on DLL called MyDll.dll which is used by outlook.exe.
I have integrated Intel Inspector 2019 with Visual Studio 2015. But when I run memory analysis, it doesn't show anything.
What Project setting I have to include. As of now it's as below
On Target Tab:
Application : C:\Program Files\Microsoft Office\Office16\OUTLOOK.EXE
Application Parameter:
Working Directory : C:\wrk\MyDLL\vcproj
What's there missing or how to do setting for it to run?
- Tags:
- CC++
- Debugging
- Development Tools
- Fortran
- Intel® Inspector
- Optimization
- Parallel Computing
- Vectorization
Link Copied
- Mark as New
- Bookmark
- Subscribe
- Mute
- Subscribe to RSS Feed
- Permalink
- Report Inappropriate Content
Hi Mahesh,
Your target settings look good to me. Which language and runtime do you use to build your module (C++/C#)? Maybe you need to check if “Microsoft* runtime environment” option is set to appropriate mode.
Take a look at ‘Collection Log’ messages and see which modules are loaded during analysis and which instrumentation mode is enabled for them. That could also give some clue what is going on there.
- Mark as New
- Bookmark
- Subscribe
- Mute
- Subscribe to RSS Feed
- Permalink
- Report Inappropriate Content
Hi Michael Tutin (Intel),
I am using C++. Visual Studio 2015. I have integrated Intel Inspector in VS 2015.
The scenario is, I have three four DLLs. Which gets attached to Outlook.exe. So my whole code is for DLL in C++.
When I run my application from Visual Studio 2015, I give outlook.exe as command path and then it launches outlook. That's how it runs normally.
Now how to do same in Intel Inspector? I am unable to do it. When i run Threading Error Analysis from Intel inspector, it doesn't launch outlook.exe as it is expected and because of that it's now giving any analysis.
- Mark as New
- Bookmark
- Subscribe
- Mute
- Subscribe to RSS Feed
- Permalink
- Report Inappropriate Content
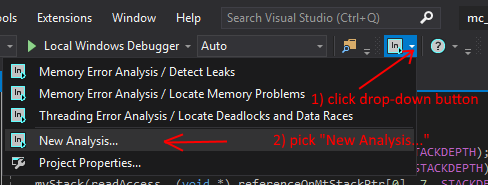
By default, Inspector inherits settings of VS Project. You may open Inspector project settings window and uncheck that box to try to specify application to launch manually. To open this dialog, click on dropdown icon on VS toolbar and choose “Project Properties…” item. The same dialog can be opened by right clicking on VS Project in Solution Explorer. There will be “Inspector > Project Properties…” menu item.
Another option would be to use Standalone Inspector GUI (inspxe-gui.exe) to run analysis. It has the same functionality except debugger integration. In the standalone client create new project and specify Outlook application as application to run.
If it doesn’t help, could you compress and attach result directory created by Inspector? I’m quite not sure which step causes a problem.
- Mark as New
- Bookmark
- Subscribe
- Mute
- Subscribe to RSS Feed
- Permalink
- Report Inappropriate Content
Hi Michael Tutin (Intel)
I am still unable to execute it.
Can you please tell me the exact project configuration for running analysis for below scenario.
1. My application is DLLs, which are plugins to outlook.exe, which gets attached to Outlook
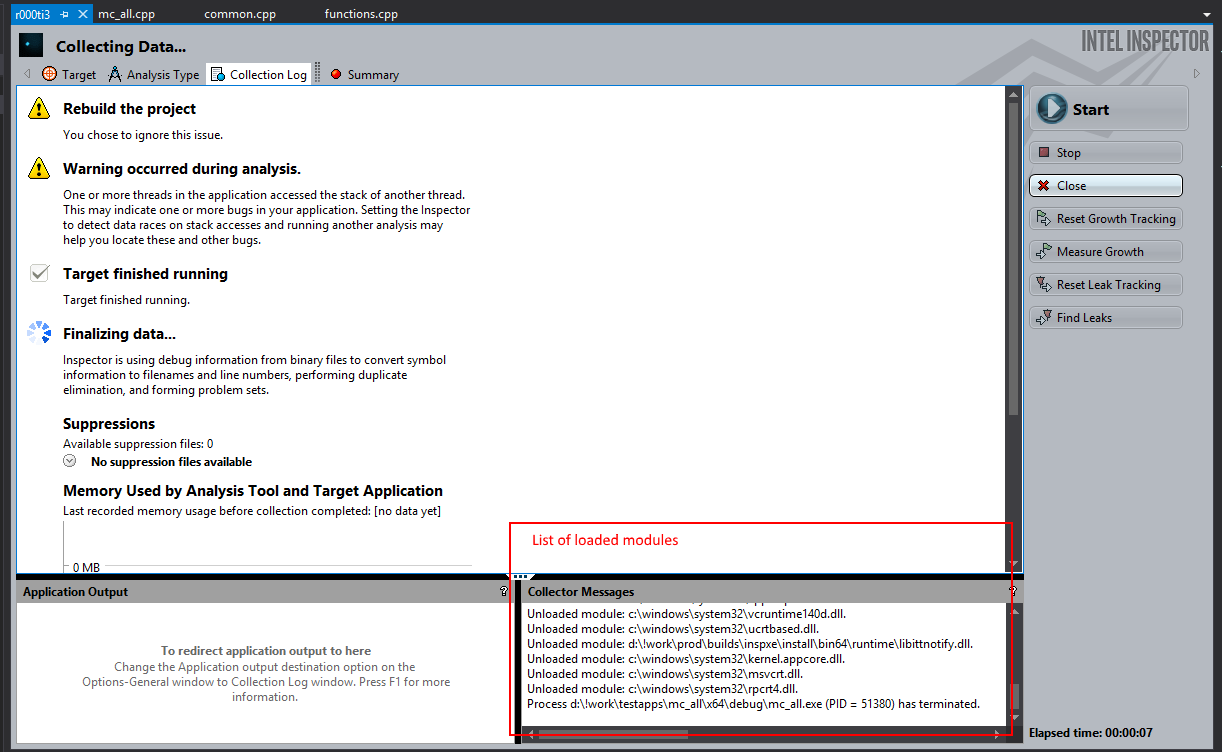
Also see the attached file for my project settings for your reference.
Most important is, it doesn't load the symbol or doesn't detect the code.
- Mark as New
- Bookmark
- Subscribe
- Mute
- Subscribe to RSS Feed
- Permalink
- Report Inappropriate Content
Hi Mahesh,
Your project configuration is correct. Just click "Start" button and see if your plugin modules are loaded into the process. There is minor issue with inexistent directory to source files, but it should not affect analysis.
What happens when you start analysis? Do you get any result?
- Mark as New
- Bookmark
- Subscribe
- Mute
- Subscribe to RSS Feed
- Permalink
- Report Inappropriate Content
Hi Mahesh,
Did Michael's recommendation help you to solve the issue?
If yes, I would mark this forum topic as solved and close the related Online Support Center ticket.
Thanks, Mariya
- Mark as New
- Bookmark
- Subscribe
- Mute
- Subscribe to RSS Feed
- Permalink
- Report Inappropriate Content
Hi Mahesh,
Since there was no reply from you for long, I suppose the issue is resolved. But if you still need support on this case, please let me know.
Thanks, Mariya
- Subscribe to RSS Feed
- Mark Topic as New
- Mark Topic as Read
- Float this Topic for Current User
- Bookmark
- Subscribe
- Printer Friendly Page