- Mark as New
- Bookmark
- Subscribe
- Mute
- Subscribe to RSS Feed
- Permalink
- Report Inappropriate Content
Can you please tell me how to provide the source code of any program to intel vtune. My goal is to observe which function in the application is taking most of the execution time. I provide the executable file to intel vtune and I am running the application in the linux environment. I have observed that in the Botton-up tab, you can select the grouping mode "source file /class/fucntion/call stack" and the "function/call stack". I was expecting to see the functions' detail implemented in the source code of the program. But that is not the case.
Do I need to provide the source code to intel vtune?
Regards
Link Copied
- Mark as New
- Bookmark
- Subscribe
- Mute
- Subscribe to RSS Feed
- Permalink
- Report Inappropriate Content
You just need to compile with the debug option, typically, -g. Are we talking about C/C++ or Java (I've seen your other posts).
If C/C++/Fortran, you also need to ensure that the executable is not stripped of symbolic info. This is often done in makefiles to reduc ethe size of the executable. Use the 'file <executable' command to determine if the file has been "stripped."
As long as you don't move the source, VTune Amplifier should find it. Optionally, you can specify the symbol search directory in the project properties or via a command-line option, if you are using the command line.
- Mark as New
- Bookmark
- Subscribe
- Mute
- Subscribe to RSS Feed
- Permalink
- Report Inappropriate Content
Program is written in C/C++. I have tried to compile the code with the -g flag using command "g++ -g program.c -o executable". It does not change anything as the output of hotspot analysis. Can you please guide me how to check whether executable is stripping symbolic information? Can you also please tell me what is the command line option for this?
Project property have the tab "source search" but when I try to provide the source code .c file there, the files are in light grey color that shows that I can not select them.
- Mark as New
- Bookmark
- Subscribe
- Mute
- Subscribe to RSS Feed
- Permalink
- Report Inappropriate Content
You don't "provide the source code files", you just specify the path. Select the directory where the source files are located.
WRT "stripped", I gave you the command in my last post (see second paragraph).
- Mark as New
- Bookmark
- Subscribe
- Mute
- Subscribe to RSS Feed
- Permalink
- Report Inappropriate Content
thanks for you response.
The output of file executable file is
executable: ELF 64-bit LSB executable, x86-64, version 1 (SYSV), dynamically linked (uses shared libs), for GNU/Linux 2.6.24, BuildID[sha1]=0x38195233234b24530d6a0bb42e75506f8efa7fa6, not stripped
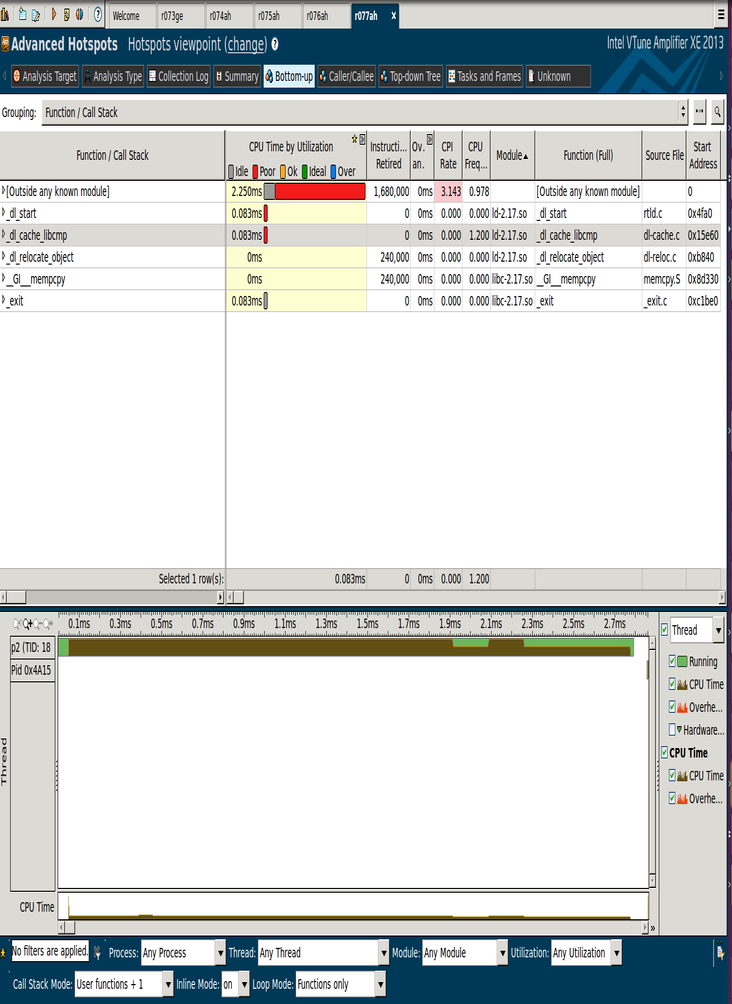
For your reference I have attached the output of the hotspot analysis and the source code. The most expensive function is "outside the known module".
- Mark as New
- Bookmark
- Subscribe
- Mute
- Subscribe to RSS Feed
- Permalink
- Report Inappropriate Content
So, what are you trying to accomplish with this app?
There are several issues: 1) there is hardly any execution time in the app - your loop of 16 iterations is too small and 2) why do you have a printf in the body of the loop. Try adding two zeros to the sixteen, e.g., 1600, and remove the printf from the body of the loop. You do not have enough processing occurring within the app? Most of the time is spent loading a dll interface, it looks like.
If you are just trying to verify correct operation, we provide several sample apps under the installation directory, e.g., <install-dir>/samples/en.
- Mark as New
- Bookmark
- Subscribe
- Mute
- Subscribe to RSS Feed
- Permalink
- Report Inappropriate Content
My goal is to observe the information in the module "outside any known module". I want to see the something similar to figure on page 6 and 7 of intel tutorial "Tutorial: Finding Hotspots". In the figures, the grouping "function/call stack" shows the functions that are called inside the source code.
I had just picked the sample c code to see if I will be able to observe the function "main" or the "for loop" with the cpu time utilization which I assume are labelled as "outside any known module" in my example.
- Mark as New
- Bookmark
- Subscribe
- Mute
- Subscribe to RSS Feed
- Permalink
- Report Inappropriate Content
You can't observe anything about "Outside any known module" because it is just that, it is outside any known module. Therefore, there is no way for VTune Amplifier to map the addresses back to a "known" module. Again, you don't have enough computation in the app and so all the samples are in some OS code that is loading up your module and shared modules.
No, "main" and "for_loop" are not part of outside any known module. Please add computation to the application and try again. Or, better yet, use one of the examples - they work! ;)
- Mark as New
- Bookmark
- Subscribe
- Mute
- Subscribe to RSS Feed
- Permalink
- Report Inappropriate Content
@Maria
I have also seen "outside any known module" when I profiled my program. It seems that VTune was not able to map assembly code of VS VCOMP library to its source code.
In your posted screenshot as MrAnderson said you must add more code in order to perform some computation which in turn can be sampled and profiled by VTune.
- Mark as New
- Bookmark
- Subscribe
- Mute
- Subscribe to RSS Feed
- Permalink
- Report Inappropriate Content
@Maria
Most of the processing time in your original version is due to printf being called from within for-loop so the real performance of your code is affected by the time spent to execute printf(user - to kernel mode transition).I am not sure why most of the time is spent in "Outside any known module" code , but I tend to think that this is not printf implementation.
- Mark as New
- Bookmark
- Subscribe
- Mute
- Subscribe to RSS Feed
- Permalink
- Report Inappropriate Content
Moreover your code example when printf function will be removed can probably be optimized out by the compiler.Number of loop iteration and initial value of exponent variable are known at compiler time.
- Subscribe to RSS Feed
- Mark Topic as New
- Mark Topic as Read
- Float this Topic for Current User
- Bookmark
- Subscribe
- Printer Friendly Page