- Mark as New
- Bookmark
- Subscribe
- Mute
- Subscribe to RSS Feed
- Permalink
- Report Inappropriate Content
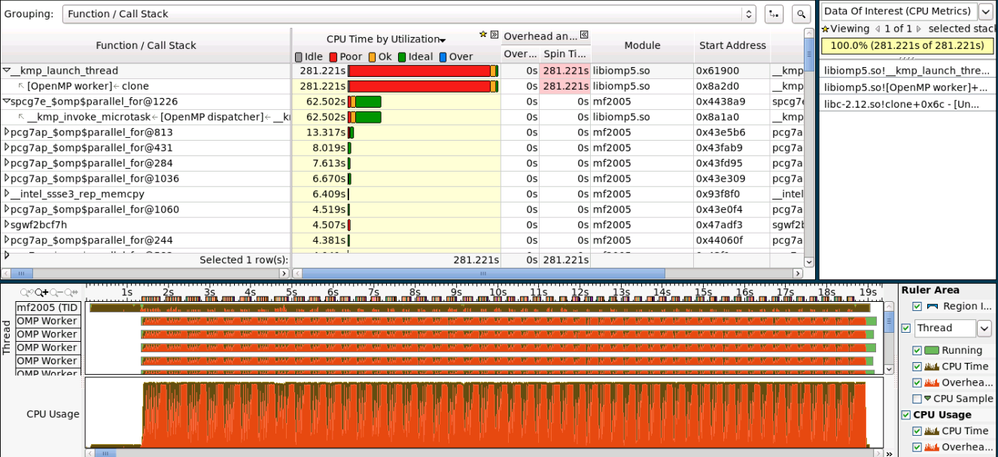
Profiling my codes, I observed some curiously large overhead and spin time, which covered almost 100% of the CPU usage bar. I use Vtune 2013 and 2015.
In the summary page, it shows : CPU time: 420.6s, Overhead time: 0.3s , Spin time:284.125, concurrency ideal.
I know that Spin time means that one thread is blocking to wait the resource free from another thread, it consumes high CPU time. However I did not use any lock. Can you please clarify this issue?
Link Copied
- Mark as New
- Bookmark
- Subscribe
- Mute
- Subscribe to RSS Feed
- Permalink
- Report Inappropriate Content
I suppose that you have many OpenMP* threads to run, but each thread worked on tiny task then sync with other threads. So accumulating wait (spin) time is huge, that was why spin time was 261s, parallel_for was 62s.
Is there any way to improve this?
1. Increase more workload in parallel OMP region, and reduce wait time.
2. Use OMP_SCHEDULE to set chunk size, or/and set expected thread number by using OMP_NUM_THREADS, it depends how many cores you have.
3. Use OMP_DYNAMIC=1 instead of STATIC to run.
4. Set OMP_WAIT_POLICY=passive, KMP_BLOCKTIME=0 instead of default 200ms
What else do you have idea to reduce spin wait time? Use VTune to rerun then compare results.
- Mark as New
- Bookmark
- Subscribe
- Mute
- Subscribe to RSS Feed
- Permalink
- Report Inappropriate Content
Hello,
Most likely it was active wait (spinning) of OpenMP worker threads on parallel region barriers.
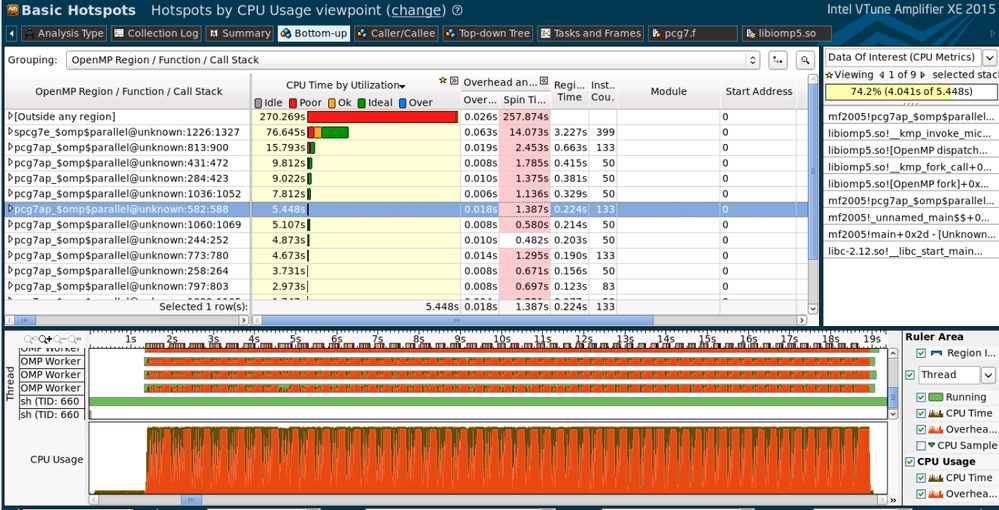
Could you please apply "OpenMP Region/Function/Stack" grouping in VTune Amplifier 2015 Beta and post the picture?

--
If it is imbalance on barriers and you have big number of iterations in a parallel loop much more than worker threads you can try dynamic scheduling to distribute the work dynamically.
#pragma omp parallel for schedule (dynamic)
By default with dynamic the work will be distributed by 1 iteration and if the number of iterations is buig it can lead to some overhead on work scheduling so you can play with chunk parameter to make it being shceduled more coarse grain:
#pragma omp parallel for schedule (dunamic, 100)
where 100 - is the number of iterations in the chunk.
Thanks & Regards, Dmitry
- Mark as New
- Bookmark
- Subscribe
- Mute
- Subscribe to RSS Feed
- Permalink
- Report Inappropriate Content
Thanks dmitry. I have applied "OpenMP Region/Function/Stack" grouping in VTune Amplifier 2015 Beta and post the picture as below:
I have tried the SCHEDULE_DYNAMIC statement, however it doesn't work. Do you have any other ideas? Appreciate.
- Mark as New
- Bookmark
- Subscribe
- Mute
- Subscribe to RSS Feed
- Permalink
- Report Inappropriate Content
@ Baoyin D
You told me if you ran 24 threads on 24 cores, overhead was reduced. But,
> When these regions are executed serially, the spin time is much smaller. However it costs more time.
I put my answers here, maybe other guys have same issue.
We need to understand why these region execute serially. Possible reasons:
1. Critical code area is too big, you need to change it to small.
2. Reduce unnecessary "locks", if possible
3. Reduce dependency between iterations, in omp for loop.
4. Reduce shared variables, change them locally if possible.
5. Change data structure - use locks for small elements in structure.
6. Other things that you can consider
- Subscribe to RSS Feed
- Mark Topic as New
- Mark Topic as Read
- Float this Topic for Current User
- Bookmark
- Subscribe
- Printer Friendly Page

