- Mark as New
- Bookmark
- Subscribe
- Mute
- Subscribe to RSS Feed
- Permalink
- Report Inappropriate Content
Intel Advisor 2021.1 :
What are the percentage numbers next to each module under module filter?
Please let me know.
- Mark as New
- Bookmark
- Subscribe
- Mute
- Subscribe to RSS Feed
- Permalink
- Report Inappropriate Content
Hi,
Intel® VTune™ Profiler optimizes application performance, system performance, and system configuration for HPC, cloud, IoT, media, storage, and more.
So you can also use vtune for this question.
You can refer to https://software.intel.com/content/www/us/en/develop/documentation/vtune-cookbook/top/tuning-recipes/openmp-imbalance-and-scheduling-overhead.html this cookbook.
Regards,
Rashmi
Link Copied
- Mark as New
- Bookmark
- Subscribe
- Mute
- Subscribe to RSS Feed
- Permalink
- Report Inappropriate Content
It's amount of time spent within corresponding module
- Mark as New
- Bookmark
- Subscribe
- Mute
- Subscribe to RSS Feed
- Permalink
- Report Inappropriate Content
Thanks for the input ...
Do you think it is a sign for over parallelization? If so, how would I be able to better track down the problem? I speculate it has too do with forcing parallelizing using #pragma omp parallel for ... so I may consider using if clauses just to avoid unnecessary parallel execution. However, I am not sure how to verify my guess ...
Please let me know what you think ...
Regards
- Mark as New
- Bookmark
- Subscribe
- Mute
- Subscribe to RSS Feed
- Permalink
- Report Inappropriate Content
Yes, the overhead you faced with can be caused by the reason you are talking about. You can try playing with OMP_NUM_THREADS env var (e.g. 1, 4 and
- Mark as New
- Bookmark
- Subscribe
- Mute
- Subscribe to RSS Feed
- Permalink
- Report Inappropriate Content
Ruslan,
Thanks for the comment I lowered the number of threads to 1 and it turns out it reduces libiomp5md.dll time. Though I am not sure whether it is a good sign or bad sign ??? I am just trying to find whether I have unnecessary parallelizing or not.
- Mark as New
- Bookmark
- Subscribe
- Mute
- Subscribe to RSS Feed
- Permalink
- Report Inappropriate Content
Probably you need to go through Threading Workflow then. Check this out - https://software.intel.com/content/www/us/en/develop/videos/introduction-to-intel-advisor-threading-workflow.html
- Mark as New
- Bookmark
- Subscribe
- Mute
- Subscribe to RSS Feed
- Permalink
- Report Inappropriate Content
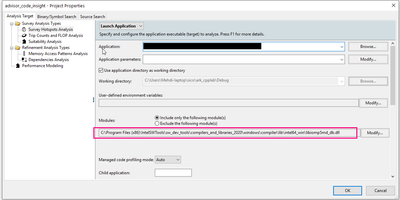
Is there any way to force IA (Intel Advisor) use omp debug dlls just to better find out ? I am not sure how I can use debug dlls....
I have tried below but no luck ....
- Mark as New
- Bookmark
- Subscribe
- Mute
- Subscribe to RSS Feed
- Permalink
- Report Inappropriate Content
Unfortunately, no. Advisor doesn't do anything like that. Could you tell what you're going to achieve doing that?
- Mark as New
- Bookmark
- Subscribe
- Mute
- Subscribe to RSS Feed
- Permalink
- Report Inappropriate Content
Hi,
Intel® VTune™ Profiler optimizes application performance, system performance, and system configuration for HPC, cloud, IoT, media, storage, and more.
So you can also use vtune for this question.
You can refer to https://software.intel.com/content/www/us/en/develop/documentation/vtune-cookbook/top/tuning-recipes/openmp-imbalance-and-scheduling-overhead.html this cookbook.
Regards,
Rashmi
- Mark as New
- Bookmark
- Subscribe
- Mute
- Subscribe to RSS Feed
- Permalink
- Report Inappropriate Content
Feel free to close the thread ...
Thank you
- Mark as New
- Bookmark
- Subscribe
- Mute
- Subscribe to RSS Feed
- Permalink
- Report Inappropriate Content
Hi,
Thanks for accepting our solution. If you need any additional information, please submit a new question as this thread will no longer be monitored.
Regards,
Rashmi
- Subscribe to RSS Feed
- Mark Topic as New
- Mark Topic as Read
- Float this Topic for Current User
- Bookmark
- Subscribe
- Printer Friendly Page


