- Mark as New
- Bookmark
- Subscribe
- Mute
- Subscribe to RSS Feed
- Permalink
- Report Inappropriate Content
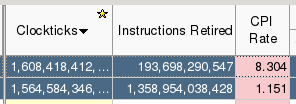
The above shows the two hottest functions in my application program.
They have really different performance characteristics.
I will denote the first one F and the second one G.
Even though F and G have the similar valeus for the metic Clockticks, F has much higher CPI rate than G does.
This is understandable since the function F performs intensive binary searches that would incur may random accesses.
But I have some difficulties in understanding the performance of the function G.
The function G consists of (1 small array look-up (with only 32 elements), 1 division, 1 branch statement).
How can I find the bottlenekcs of the function G given the Vtune profiling results?
Is there any reference documents that explain the meaning of the above hardware counters? Googling does not give much helps.
Link Copied
- Mark as New
- Bookmark
- Subscribe
- Mute
- Subscribe to RSS Feed
- Permalink
- Report Inappropriate Content
Hello,
What VTune analysis type did you use?
Could you please run general exploration analysis ("-collect general-exploration" or corresponding analysis in GUI) and publish results for the function mentioned? It will show stalls by execution pipeline stages and it will be simpler to judge why CPI is low.
Thanks & Regards, Dmitry
- Mark as New
- Bookmark
- Subscribe
- Mute
- Subscribe to RSS Feed
- Permalink
- Report Inappropriate Content
Hi, the above results is from the general-exploration. or don't you see the pictures here?
dmitry-prohorov (Intel) wrote:
Hello,
What VTune analysis type did you use?
Could you please run general exploration analysis ("-collect general-exploration" or corresponding analysis in GUI) and publish results for the function mentioned? It will show stalls by execution pipeline stages and it will be simpler to judge why CPI is low.
Thanks & Regards, Dmitry
- Mark as New
- Bookmark
- Subscribe
- Mute
- Subscribe to RSS Feed
- Permalink
- Report Inappropriate Content
I see that the pictures 2-4 are with columns with event names rather than metrics like "Backend Bound", "Frontend Bound" etc.
Probably you use "Hardware Events" viewpoint rather than "General Exploration" that gives you raw counters not General Exploration metrics.
Thanks & Regards, Dmitry
- Mark as New
- Bookmark
- Subscribe
- Mute
- Subscribe to RSS Feed
- Permalink
- Report Inappropriate Content
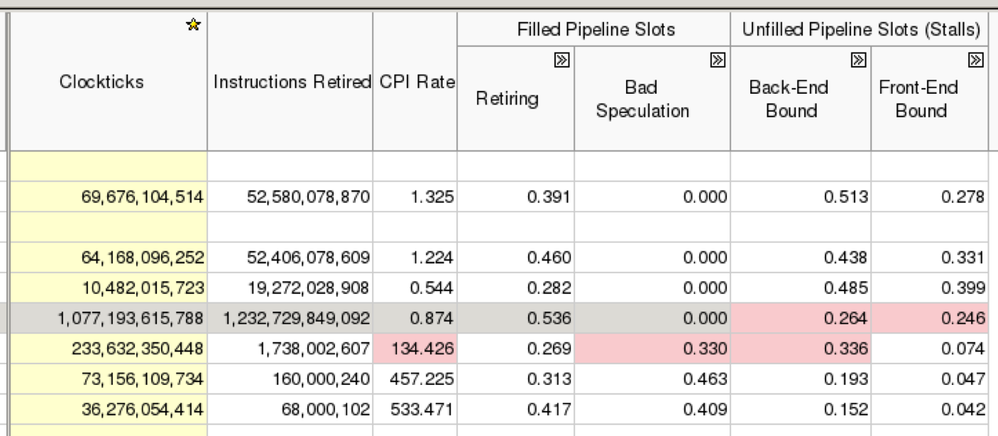
Here I add an image that shows "Backend Bound", "Frontend Bound" etc for the function G.
Back-End bound and Front-End bound are 0.264 and 0.246 respectively.
How can I interpret it?
- Mark as New
- Bookmark
- Subscribe
- Mute
- Subscribe to RSS Feed
- Permalink
- Report Inappropriate Content
Hi Seongyun,
The General Exploration analysis allows you to narrow down your problem from top to bottom. The numbers highlighted in pink are ones that Intel VTune Amplifier has deemed problematic. If you will look at the columns they belong to, you will see a symbol that looks like a box with two right-pointing angle brackets in it: [>>]. Clicking this box will expand the column and split it into sub-columns. Entries in these sub-columns will also be highlighted in pink if they are problematic. The sub-columns can usually also be expanded. If you keep expanding the pink ones you should be able to narrow down the problem.
For example, say row N has the Back-End Bound column in pink. You expand this column, and it shows two sub columns: core bound and memory bound. Say the core bound column is white for row N, but memory bound is pink. This means that the reason it is Back-End Bound is that it is specifically Memory Bound. So you would then expand the Memory Bound column, and it would show you L1 binding, L2 binding, and so on. So you would be able to keep doing this until you determined that your bottleneck was that the function N was L2 bound. And from there you could perform memory optimizations to try to use L2 memory more efficiently.
This link may be of some interest: https://software.intel.com/en-us/top-down-microarchitecture-analysis-method-win
I hope this brief explanation helps somewhat. :)
- Alex
- Subscribe to RSS Feed
- Mark Topic as New
- Mark Topic as Read
- Float this Topic for Current User
- Bookmark
- Subscribe
- Printer Friendly Page


