- Mark as New
- Bookmark
- Subscribe
- Mute
- Subscribe to RSS Feed
- Permalink
- Report Inappropriate Content
Hello all,
I have an Iris Plus Graphics 655 GPU (Gen 9.5) with DPC++ code that runs a kernel with a parallel_for and that create an array on the stack (ex. uint32_t array[128]).
Is this allocation automatically put on the L1 Cache of the Execution Unit (EU)?
I can't understand this from vtune
Thank you
Link Copied
- Mark as New
- Bookmark
- Subscribe
- Mute
- Subscribe to RSS Feed
- Permalink
- Report Inappropriate Content
Hi,
Thanks for posting in Intel Communities.
>>"I can't understand this from vtune"
Could you please provide the results of the VTune profiler?
Could you please let us know which device selector (CPU/GPU/default)you are using?
Thanks & Regards,
Hemanth
- Mark as New
- Bookmark
- Subscribe
- Mute
- Subscribe to RSS Feed
- Permalink
- Report Inappropriate Content
Hello Hemanth
I'm using the default selector and the GPU is correctly selected
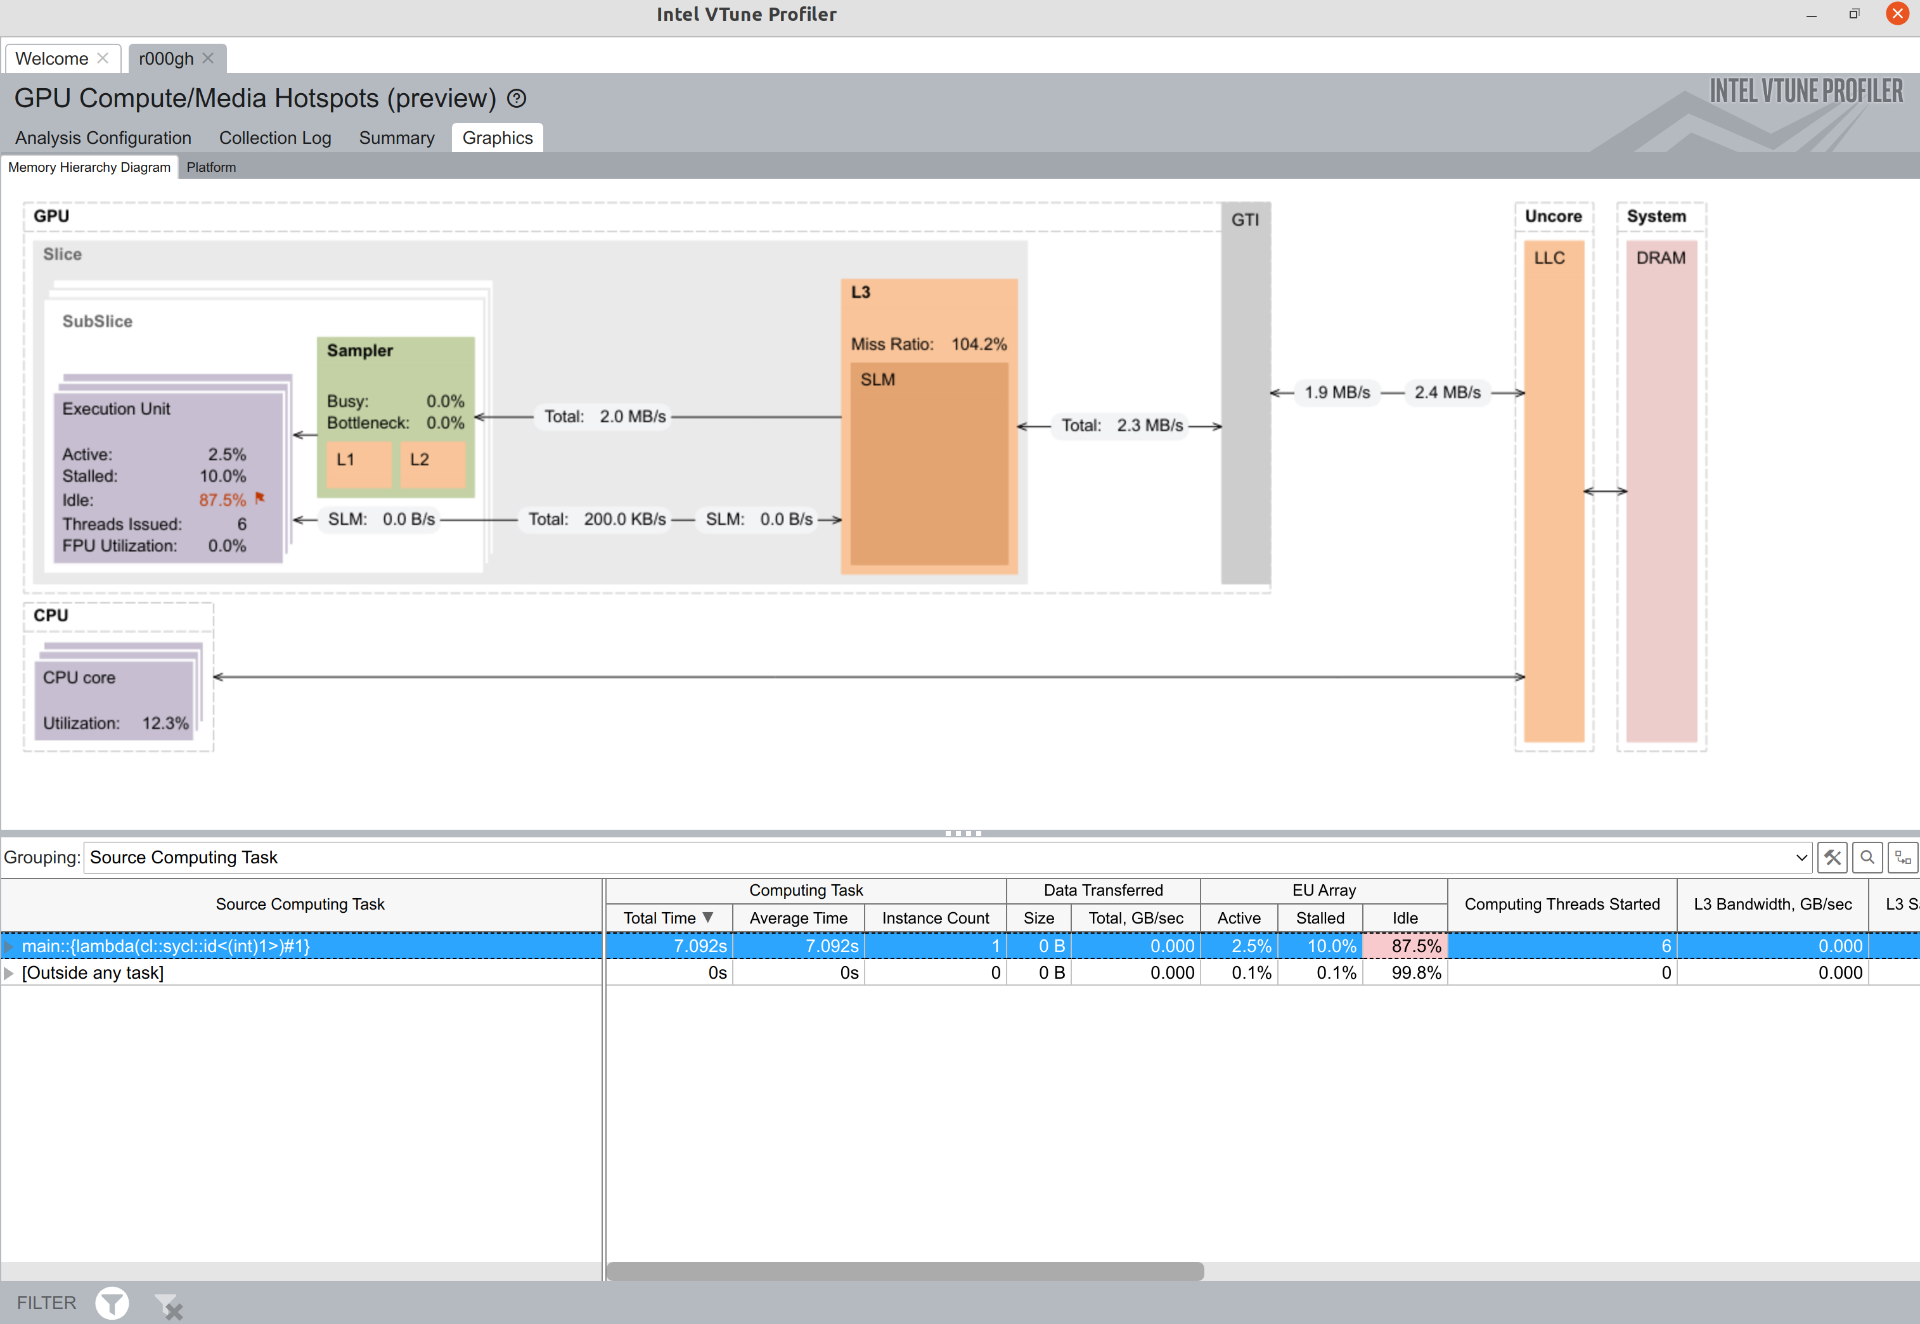
Attached VTune results and a demo I prepared to expose the problem, compiled with
dpcpp -std=c++17 -fsycl -O2 -g HelloOneApi.cpp
I was expecting to see the local array promoted to registers and this reflected someway in the profiler, but I can't understand this from the VTune report. If I use a bigger local array size I was expecting L1 (Sampler cache) to be used, but can't see this too.
I had to run VTune from Ubuntu because is not working on Windows:
- Always interrupt the collection before the end of the application and tell me that the collected file is corrupted (see attached screenshoot)
- I can't fully install the sampling driver on Windows 10 too (see attached screenshoot)
Thank you,
Leonardo
- Mark as New
- Bookmark
- Subscribe
- Mute
- Subscribe to RSS Feed
- Permalink
- Report Inappropriate Content
Hi,
Thanks for the update.
We are working on this. We will get back to you soon.
Regards,
Janani Chandran
- Mark as New
- Bookmark
- Subscribe
- Mute
- Subscribe to RSS Feed
- Permalink
- Report Inappropriate Content
Hello,
Here is the response from our team:
The per work-item array will be tried in GRF (general-purpose register file) and will spill onto global memory if too big on Gen9, because L1 cache is read-only on Gen9 and ATS.
The array referred is the private for each work item. If so, private memory in SYCL is typically mapped to hardware registers if the size fits. I believe each EU has 7 threads for a total of 28KB of general purpose register in Gen9 based Intel GPU (see figure 3 on page 6, https://www.intel.com/content/dam/develop/external/us/en/documents/the-compute-architecture-of-intel-processor-graphics-gen9-v1d0.pdf). The situation will depend on the number of work items as well as the array size. I would expect caching register spill is reasonable when that is necessary, as SYCL runtime will always aim to allocate memory in the most optimal way.
- Mark as New
- Bookmark
- Subscribe
- Mute
- Subscribe to RSS Feed
- Permalink
- Report Inappropriate Content
Hello Jeffrey,
Thank you very much for your detailed response.
Any chance to get the issues described with VTune fixed on Windows 10?
Thank you,
Leonardo
- Mark as New
- Bookmark
- Subscribe
- Mute
- Subscribe to RSS Feed
- Permalink
- Report Inappropriate Content
Hello Leonardo,
To debug the Windows data collection driver issues, please see https://www.intel.com/content/www/us/en/develop/documentation/vtune-help/top/set-up-analysis-target/windows-targets/install-sampling-drivers-for-windows-targets.html
Note: you must run VTune Profiler as Administrator for most of the data collection analysis types.
- Mark as New
- Bookmark
- Subscribe
- Mute
- Subscribe to RSS Feed
- Permalink
- Report Inappropriate Content
Hello Leonardo,
Regarding the Windows VTSS++ issue, what version of Windows is this and what is the processor on that system?
E.g. Windows 10 Enterprise 21H2 19044.1889
Thank you.
- Mark as New
- Bookmark
- Subscribe
- Mute
- Subscribe to RSS Feed
- Permalink
- Report Inappropriate Content
Hello,
Was an Intel NUC 8i5 with an i5-8259U
OS was Windows 10 Pro version 10.0.19044.1706
Cheers,
Leonardo
- Mark as New
- Bookmark
- Subscribe
- Mute
- Subscribe to RSS Feed
- Permalink
- Report Inappropriate Content
Hello Leonardo,
Thank you for the configuration information. I was able to reproduce the VTSS++ issue on a similar configuration. As a workaround, I uninstalled VTune Profiler and then re-installed VTune Profiler and was able to run "amplxe-sepreg -s" to verify the VTune installer properly loaded the drivers for collecting data with the hardware event-based sampling driver.
We are working on a fix for the "amplxe-sepreg -i" issue in a future release.
- Mark as New
- Bookmark
- Subscribe
- Mute
- Subscribe to RSS Feed
- Permalink
- Report Inappropriate Content
Hello Jeffrey,
I don't have that computer anymore, I moved to an i7-1260P / RTX3060 with CUDA and I don't have VTune installed now. I'll try OneApi again in future maybe.
Thanks anyway
- Mark as New
- Bookmark
- Subscribe
- Mute
- Subscribe to RSS Feed
- Permalink
- Report Inappropriate Content
Hello Leonardo,
Thank you for the update? Can we close this issue?
- Mark as New
- Bookmark
- Subscribe
- Mute
- Subscribe to RSS Feed
- Permalink
- Report Inappropriate Content
Hello Jeffrey,
Yes, we can close it but please keep prioritizing the bug fix as I would like to use OneApi again in future, when more stable and without this kind of bugs.
Cheers,
Leonardo
- Mark as New
- Bookmark
- Subscribe
- Mute
- Subscribe to RSS Feed
- Permalink
- Report Inappropriate Content
Thank you Leonardo,
Yes, we will continue to track the bug and fix it in a future release.
- Subscribe to RSS Feed
- Mark Topic as New
- Mark Topic as Read
- Float this Topic for Current User
- Bookmark
- Subscribe
- Printer Friendly Page