- Mark as New
- Bookmark
- Subscribe
- Mute
- Subscribe to RSS Feed
- Permalink
- Report Inappropriate Content
From the documents, I read that the attribution of cycles to instructions or source code lines can sometimes be one off. A line too early, or too late.
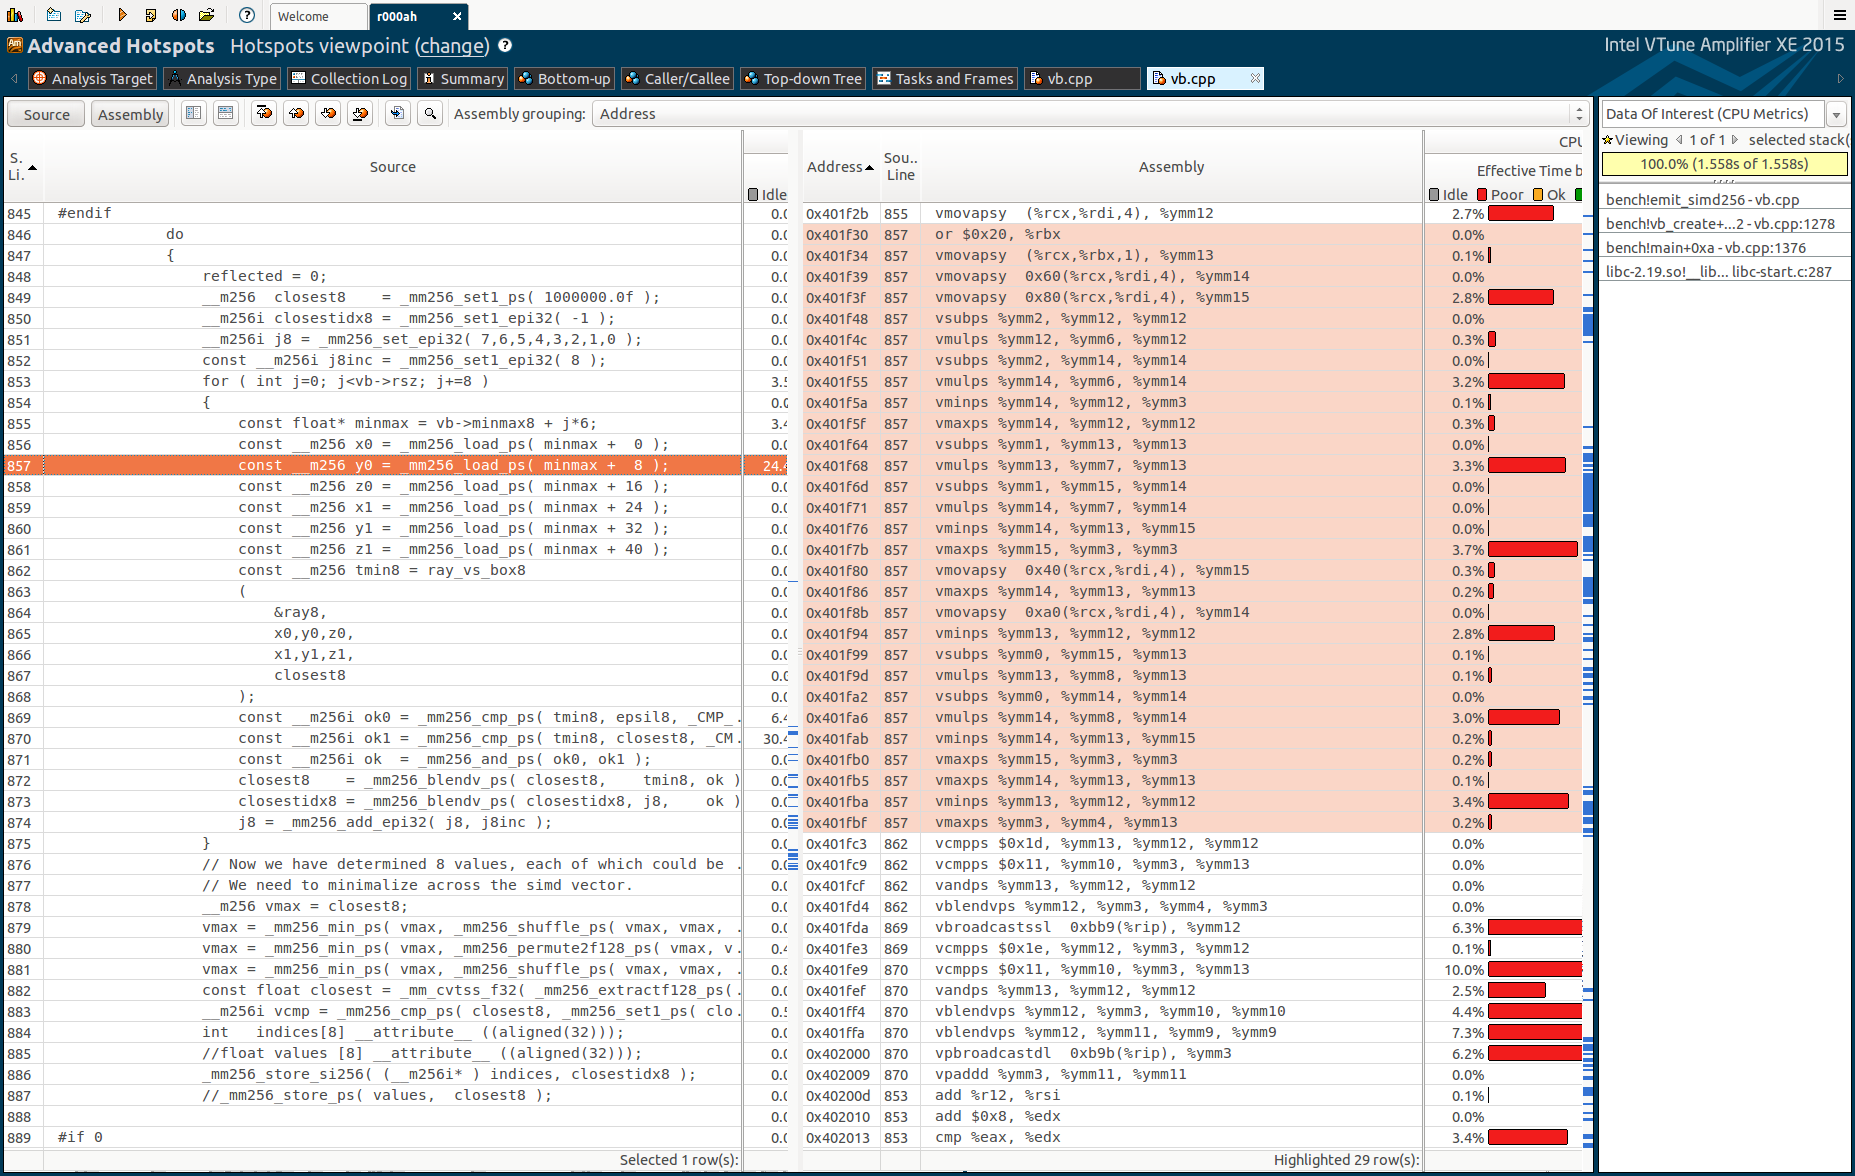
In my run, I see very inaccurate mappings. Both between source code and assembly code. And also between cycles spent and source code. See the attached screen shot. My source code is mostly intrinsics, so I have a pretty good understanding to what it should map. Yet, a simple intrinsic sometimes maps to a whole page of assembly? How could this be?
In the example from the screenshot: a single _mm256_load_ps() gets mapped to 29 assembly instructions?
And the cycles do not evenly distribute over my source code lines: almost all lines get no cycles attributed, only a sparse few get all the cycles?
- Mark as New
- Bookmark
- Subscribe
- Mute
- Subscribe to RSS Feed
- Permalink
- Report Inappropriate Content
Hi Bram!
VTune relies on compiler mapping between instructions and source code. In case of highly optimized code compiler can miss actual attribution and generate wrong mapping. Which compiler version are you using?
To check the quality of debug info you can use addr2line tool - use it for the address range on your screenshot (0x401f30-0x401fbf) to see if it returns the same source line (vb.cpp:857). If source lines are different, we'll need your binary with debug info to triage this issue.
Also, please make sure that changing Inline Mode (switch at the bottom of GUI window) doesn't affect line attribution in this case.
Link Copied
- Mark as New
- Bookmark
- Subscribe
- Mute
- Subscribe to RSS Feed
- Permalink
- Report Inappropriate Content
Was your code compiled with debug symbols? Before compilation process enable creation of .cod file where you can see source code with its assembly.
- Mark as New
- Bookmark
- Subscribe
- Mute
- Subscribe to RSS Feed
- Permalink
- Report Inappropriate Content
- Mark as New
- Bookmark
- Subscribe
- Mute
- Subscribe to RSS Feed
- Permalink
- Report Inappropriate Content
Hi Bram!
VTune relies on compiler mapping between instructions and source code. In case of highly optimized code compiler can miss actual attribution and generate wrong mapping. Which compiler version are you using?
To check the quality of debug info you can use addr2line tool - use it for the address range on your screenshot (0x401f30-0x401fbf) to see if it returns the same source line (vb.cpp:857). If source lines are different, we'll need your binary with debug info to triage this issue.
Also, please make sure that changing Inline Mode (switch at the bottom of GUI window) doesn't affect line attribution in this case.
- Mark as New
- Bookmark
- Subscribe
- Mute
- Subscribe to RSS Feed
- Permalink
- Report Inappropriate Content
Vitaly Slobodskoy (Intel) wrote:
Hi Bram!
VTune relies on compiler mapping between instructions and source code. In case of highly optimized code compiler can miss actual attribution and generate wrong mapping. Which compiler version are you using?
$ clang --version
Ubuntu clang version 3.5-1ubuntu1 (trunk) (based on LLVM 3.5)
Target: x86_64-pc-linux-gnu
Thread model: posix
Vitaly Slobodskoy(Intel) wrote:
To check the quality of debug info you can use addr2line tool - use it for the address range on your screenshot (0x401f30-0x401fbf) to see if it returns the same source line (vb.cpp:857). If source lines are different, we'll need your binary with debug info to triage this issue.
Also, please make sure that changing Inline Mode (switch at the bottom of GUI window) doesn't affect line attribution in this case.
The addr2line tool gives the same mapping. So I understand that the compiler is imprecise, not vtune. Thank you for your reply.
- Subscribe to RSS Feed
- Mark Topic as New
- Mark Topic as Read
- Float this Topic for Current User
- Bookmark
- Subscribe
- Printer Friendly Page