- Mark as New
- Bookmark
- Subscribe
- Mute
- Subscribe to RSS Feed
- Permalink
- Report Inappropriate Content
Vtune reports some profiled code (general exploration) as 29.7% memory bound, with L1 Bound highlighted at 0.173. I want to know why this is, but all the constituent parameters except for DTLB (.006) are greyed out and "cannot be reliably calculated". I also profiled for a long time to make sure a good number of samples were collected (>20minutes).
I read elsewhere that this L1 bound metric may have some interaction with port utilization. How can I tell what is actually going on here? Is there a way to get the tool to actually report these other metrics that influence L1 bound?
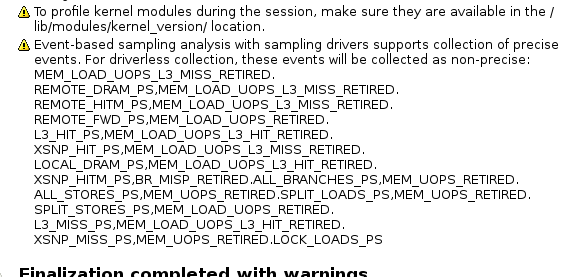
Does it perhaps have something to do with the warnings about events being collected as non-precise? screenshot attached.
Thanks!
Link Copied
- Mark as New
- Bookmark
- Subscribe
- Mute
- Subscribe to RSS Feed
- Permalink
- Report Inappropriate Content
Stuart,
Thank you for using Intel tools and asking good questions.
You use vTune without vTune sampling driver. A perf linux utility is used for this purposes.
Perf utility on some Linux and HW combinations does not have capabilities to collect precise events. A non-precise events are used instead. The non precise events have some difficulties to determine an instruction caused event. So vTune user should apply more architectural knowledge to interpret results correctly.
To solve the issue just build and install sampling driver as described here https://software.intel.com/en-us/sep_driver
Regarding the results you've got. Your application has major problems with port utilization. Since there are no other problems highlighted this means that and out-of-order execution engine does not have enough independent instructions to execute.
There are several recommendations for this case
1. perform aggressive unrolling for hotspot loops
2. perform aggressive inlining for hotspot loops
3. Vectorize code
4. use IPO, PGO compiler optimizations
5. Parallelize code and enable hyperthreading
You can run Intel Advisor to analyse vectorisation issues in your code and analyse an instruction mix compute/memory ratio.
Regards,
Dmitry
- Mark as New
- Bookmark
- Subscribe
- Mute
- Subscribe to RSS Feed
- Permalink
- Report Inappropriate Content
Thanks Dmitry, I had not realized the machine had rebooted at some point and the drivers were no longer loaded.
I'm able to collect the data I need now.
However, when I run VTune (amplxe-gui) over ssh -X with the drivers loaded, the connection is always interrupted (a broken pipe error from ssh) a few seconds after collection begins.
Is this possibly a bug, or is it a known issue?
- Stuart
- Subscribe to RSS Feed
- Mark Topic as New
- Mark Topic as Read
- Float this Topic for Current User
- Bookmark
- Subscribe
- Printer Friendly Page