- Mark as New
- Bookmark
- Subscribe
- Mute
- Subscribe to RSS Feed
- Permalink
- Report Inappropriate Content
Hello,
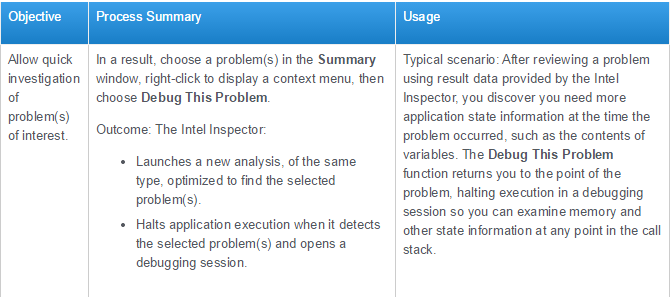
I'm trying to attach my debugger to see a data race in the act, but I can't find the context menu item "Debug This Problem" explained in the documentation "About Investigating Problems Using Interactive Debugging" ( https://software.intel.com/en-us/node/528095 ):
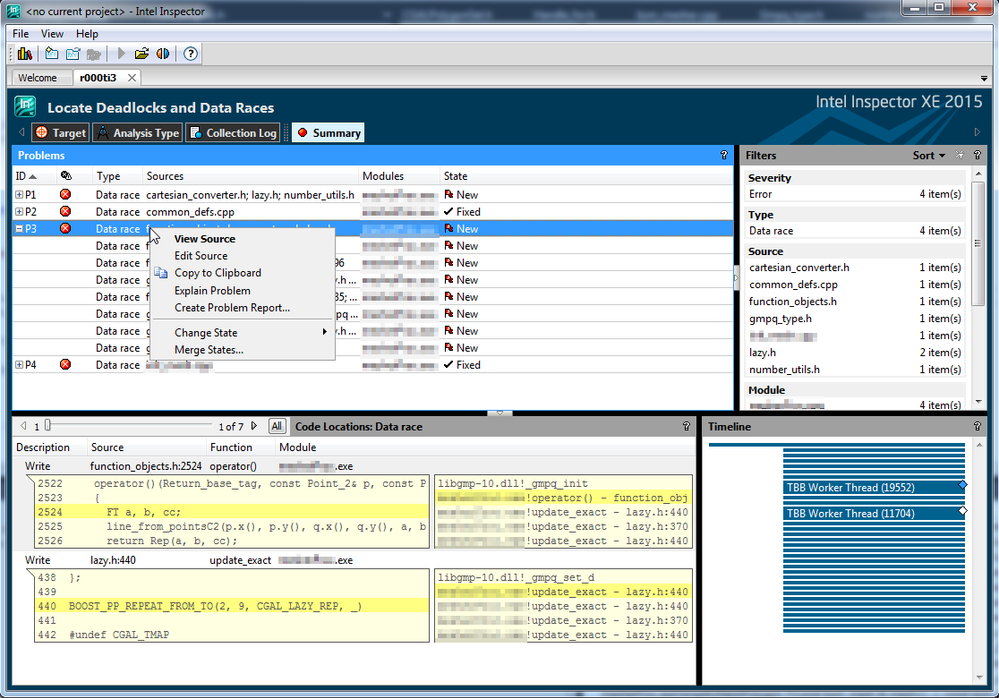
Here is a screenshot with the context menu I expected would could contain the context menu item, but I don't see it. Where is the "Debug This Problem" context menu item?
I am running Intel Inspector XE 2015 Update 1 (build 379161) on Windows 7 with Visual Studio Professional 2012 Update 4 (without Intel extensions installed with Visual Studio). I collected the results like this:
inspxe-cl.exe -collect=ti3 -k use-maximum-resources=true -suppression-file=../default.sup -- foo.exe arg1 arg2
My application foo.exe is a release build -- I hope that doesn't somehow prevent interactive debugging from working (because I can't reproduce the data race in a small enough data set that could complete in a feasible amount of time in a debug build).
Thanks,
John
Link Copied
- Mark as New
- Bookmark
- Subscribe
- Mute
- Subscribe to RSS Feed
- Permalink
- Report Inappropriate Content
You need to be running Inspector integrated into Visual Studio for interactive debugging to work.
- Mark as New
- Bookmark
- Subscribe
- Mute
- Subscribe to RSS Feed
- Permalink
- Report Inappropriate Content
Thanks Mark, interactive debugging is working for me now.
- Subscribe to RSS Feed
- Mark Topic as New
- Mark Topic as Read
- Float this Topic for Current User
- Bookmark
- Subscribe
- Printer Friendly Page

