- Mark as New
- Bookmark
- Subscribe
- Mute
- Subscribe to RSS Feed
- Permalink
- Report Inappropriate Content
Intel® VTune™ Amplifier XE 2013 Update 5 (released Feb. 26, 2013) includes a new experimental feature that can be enabled with an environment variable.
An experimental feature is a beta quality feature that may or may not appear in a future production release. We need feedback from users who try it on real code to tell us if we should keep it, change it or drop it. Note: data collected with the experimental feature enabled is not guaranteed to be backward compatible with future releases. Please give this new feature a try, and tell us what you think!
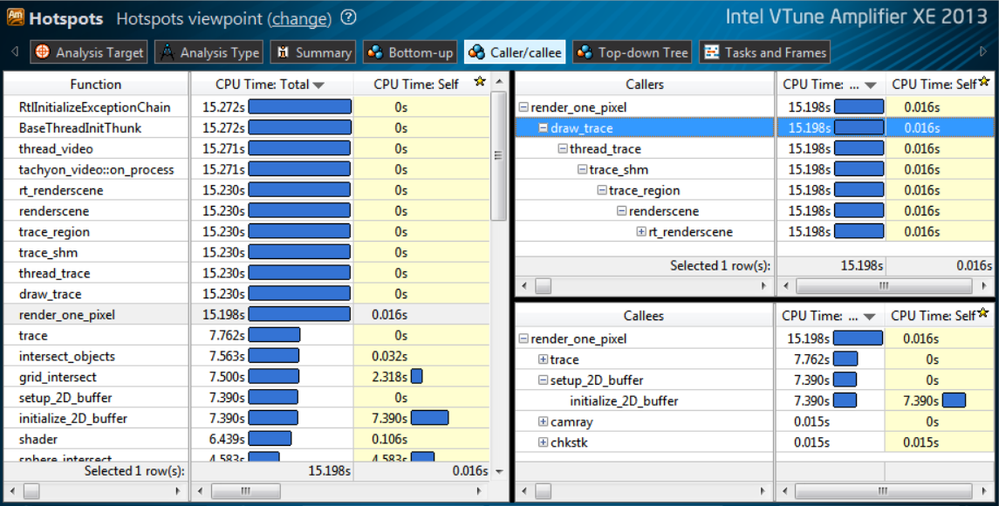
The Caller/Callee View, when enabled, provides the ability to explore functions calling the selected function (callers) and functions called by the selected function (callees), and is displayed as a separate tab in all viewpoints that include call stack data (e.g., Hotspots and Lightweight-Hotspots, General Exploration, etc. when the "Collect stacks" options has been checked).
Below is an example display in which you can see that:
- The left window is a flat profile view with functions and attributed self and total time metrics.
- The top right window shows callers of a selected function in the flat profile as a bottom-up tree with total metrics.
- The bottom right window shows callees of the selected function as s top-down tree.
- By right-clicking on any function, a context menu is displayed that allows you to filter the data, as in other views, as well as other actions appropriate for the view. Filtering is done on Total Time basis, so you get all sub-trees that include the selected function at any level.
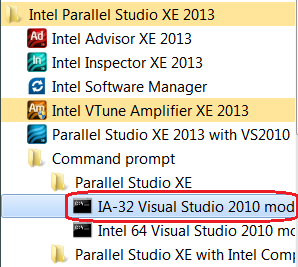
To enable this new, experimental feature, set the AMPLXE_EXPERIMENTAL environment variable equal to “caller-callee” and launch the product. On Windows*, open a command prompt from the Startup menu:
And execute the following commands:
C:\> set AMPLXE_EXPERIMENTAL=caller-callee
C:\> amplxe-gui
Or, on Linux, source the variables and execute the commands, e.g.:
$ source /opt/intel/vtune_amplifier_xe/amplxe-vars.sh
$ export AMPLXE_EXPERIMENTAL=caller-callee
$ amplxe-gui &
Please try it and post your questions, comments, and suggestions in this thread.
Link Copied
- Mark as New
- Bookmark
- Subscribe
- Mute
- Subscribe to RSS Feed
- Permalink
- Report Inappropriate Content
Very useful feature.
- Mark as New
- Bookmark
- Subscribe
- Mute
- Subscribe to RSS Feed
- Permalink
- Report Inappropriate Content
Hey, thanks, iliyapolak! I'm sorry about being slow in getting back to you, but I'm wondering if you can expound on your comment, or is it just a general comment? I mean, did you try applying it to some code you are working on? What kind of problems do you think it will help you find/resolve?
Thanks, again!
- Mark as New
- Bookmark
- Subscribe
- Mute
- Subscribe to RSS Feed
- Permalink
- Report Inappropriate Content
Hi MrAnderson,
no my comment is general:) Sorry , but for profiling I use Xperf.
- Subscribe to RSS Feed
- Mark Topic as New
- Mark Topic as Read
- Float this Topic for Current User
- Bookmark
- Subscribe
- Printer Friendly Page


