- Mark as New
- Bookmark
- Subscribe
- Mute
- Subscribe to RSS Feed
- Permalink
- Report Inappropriate Content
I am fairly new to Vtune and multithreaded stuff. Running C++11 on Windows in Visual Studio.
I have a thread that is basically a while-loop that runs a few commands and then puts the thread to sleep for 50 msec. Basically, it is a thread to run every 50 msec (I know, it doesn't really account for the few commands, but I inherited the code and it isn't that important).
For a test, I run a known set of test vectors for 90 seconds, and the analysis Summary always says that Sleep is the top waiting object. I'm probably not thinking about it correctly, because that particular sleep command I know about and don't really care about. I care about the commands in the thread that are running when it is not asleep.
It is hard to explain to management why "Wait Time with poor CPU Utilization" has the top object as "Sleep" and that it is expected and intended. I guess that this is more of a threading question, but I thought that putting a thread to sleep was the right thing to do, freeing up the OS to work on other things. It's not like I put in a busy-wait loop or something.
Back to the Vtune question, when I look at this thread, it says that it has a wait count of ~1800. I think that it is counting the number of times that the thread goes to sleep. (1800 / 50 ms ~= 90 s). It seems strange to me that it is counting the number of times the thread has to wait upon itself.
Am I thinking about this correctly? Any insights?
Thanks,
Brett
Link Copied
- Mark as New
- Bookmark
- Subscribe
- Mute
- Subscribe to RSS Feed
- Permalink
- Report Inappropriate Content
Hi,
Thank you for posting in Intel Communities.
Could you please share the sample reproducer code and exact steps to reproduce the same from our side.
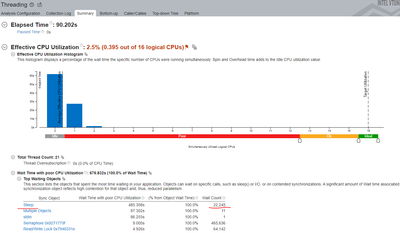
We try to analyze a similar c++ code in Windows using VTune 2023.2 and got the below results. Please refer the below screenshots:
The following aspects of Threading Analysis provide possible reasons for poor CPU utilization:
Thread count: a quick glance at the application thread count can give clues to threading inefficiencies, such as a fixed number of threads that might prevent the application from scaling to a larger number of cores or lead to thread oversubscription.
Wait time (trace-based or context switch-based): analyze threads waiting on synchronization objects or I/O.
Spin and overhead time: Threading analysis shows how much time the application spends in threading runtimes either because of busy waits or overhead on parallel work arrangement.
Threading analysis helps to analyze thread wait time and find synchronization bottlenecks. A high thread wait time can cause poor CPU utilization. In the Bottom-up window you can identify the most performance critical synchronization objects. Although it varies, often there are non-interesting threads waiting for a long time on objects infrequently. Usually VTune recommended to focus your tuning efforts on the waits with both high Wait Time and Wait Count values, especially if they have poor utilization/concurrency.
Please refer the below links for more detailed information:
If you have any further doubts, please let us know.
Thanks
- Mark as New
- Bookmark
- Subscribe
- Mute
- Subscribe to RSS Feed
- Permalink
- Report Inappropriate Content
Thanks for the input. It will probably take me some time to get a representative sample to run, but I can show a few things. I think we are talking about the same thing.
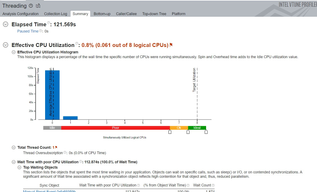
Here is the summary
The soundsThread is a simple one line call to sends an event to a external sound board. What I don't understand is why the soundThread ever has a wait, since I am telling it to go to sleep and then it should wake up X milliseconds later. It is not like something else is calling the soundsThread while it is sleeping, which is what this seems to imply to me.
Also, how does it determine the gray and red bars. If it is asleep, I would assume that it would be idle the entire time. If I drill down, I do not see any time being consumed by sending my event to the sound board.
Thanks,
Brett
- Mark as New
- Bookmark
- Subscribe
- Mute
- Subscribe to RSS Feed
- Permalink
- Report Inappropriate Content
Hi,
Thank you for the update. To assist you further, could you please share the below details:
- sample reproducer code and exact steps you followed
- OS and Hardware details
- VTune version
Thanks
- Mark as New
- Bookmark
- Subscribe
- Mute
- Subscribe to RSS Feed
- Permalink
- Report Inappropriate Content
Hi,
We have not heard back from you. Could you please give us an update?
Thanks
- Mark as New
- Bookmark
- Subscribe
- Mute
- Subscribe to RSS Feed
- Permalink
- Report Inappropriate Content
I am running Vtune 2023.0.0 build 624757 with VS 2019 version 16.11.9 on an Intel i7-11850H @ 2.5GHz - 8 cores.
Here is some sample code which I run for 60 seconds:
#include <iostream>
#include <thread>
int main()
{
unsigned int counter{0};
while (1) {
counter++;
std::cout << counter << std::endl;
std::this_thread::sleep_for(std::chrono::milliseconds(500));
}
}
When I run it for 60 seconds, it records:
So, why are there waits on operator<< and sleep_for() functions? The thread shouldn't be sleeping while doing output, so what is is it waiting for?
Similarly, I tell the thread to go to sleep, so why is there a wait count of 117 for the sleep_for function?
I would expect the wait count to be zero for both of those.
Thanks,
Brett
- Mark as New
- Bookmark
- Subscribe
- Mute
- Subscribe to RSS Feed
- Permalink
- Report Inappropriate Content
Hi,
Thank you for sharing the details. We are checking on this internally, will get back to you with an update.
Thanks
- Mark as New
- Bookmark
- Subscribe
- Mute
- Subscribe to RSS Feed
- Permalink
- Report Inappropriate Content
Hi,
The Intel VTune profiler reports wait counts for functions like std::this_thread::sleep_for, which might seem counterintuitive since these functions intentionally put threads to sleep. However, VTune profiles system activity comprehensively, tracking time spent in various thread states, including waiting periods.
When a thread enters a sleep state via functions like sleep_for, it's intentionally not performing active computations, allowing the operating system to allocate CPU resources to other tasks. Despite the thread being inactive during sleep, VTune tracks time spent in different thread states, including sleep or wait states, to provide a holistic view of an application's behavior and resource utilization.
If you need any further clarification, please let us know.
Thanks
- Mark as New
- Bookmark
- Subscribe
- Mute
- Subscribe to RSS Feed
- Permalink
- Report Inappropriate Content
Hi,
We have not heard back from you. Could you please give us an update?
Thanks
- Mark as New
- Bookmark
- Subscribe
- Mute
- Subscribe to RSS Feed
- Permalink
- Report Inappropriate Content
Hi,
Since we didn't hear back from you, we assume that your issue is resolved. If you need any additional information, please post a new question as this thread will no longer be monitored by Intel.
Thanks
- Subscribe to RSS Feed
- Mark Topic as New
- Mark Topic as Read
- Float this Topic for Current User
- Bookmark
- Subscribe
- Printer Friendly Page


