- Mark as New
- Bookmark
- Subscribe
- Mute
- Subscribe to RSS Feed
- Permalink
- Report Inappropriate Content
After running a "Advanced Hotspots" analysis, no functions are listed in any of the Hotspots viewpoint tabs.
A 218MiB r008ah/data.0/*.tb6 file is created, so it seems the sampling profiler is recording something.
A "Basic Hotspots" analysis does show some results.
VTune is running on Scientific Linux 6. The sampling drivers appear to be installed correctly. The application is build with g++ 4.8, with -O3. Profiling is started by attaching to a running process and starting recording.
I'm new to VTune, so am not sure where to start troubleshooting. Any advice would be appreciated.
Link Copied
- Mark as New
- Bookmark
- Subscribe
- Mute
- Subscribe to RSS Feed
- Permalink
- Report Inappropriate Content
Hi Joe:
You say you are building with -O3. Are you including debug info via -g? Is the file being "stripped" of symbols (execute: 'file <executable>' and make sure you see "not stripped")?
You also say "no functions" are being displayed. What *is* being displayed? Do you see your executable in square brackets, e.g., [modulename]?
- Mark as New
- Bookmark
- Subscribe
- Mute
- Subscribe to RSS Feed
- Permalink
- Report Inappropriate Content
-g is on the command line, and the file command reports that the file is not stripped. objdump -x reports seven .debug_* sections.
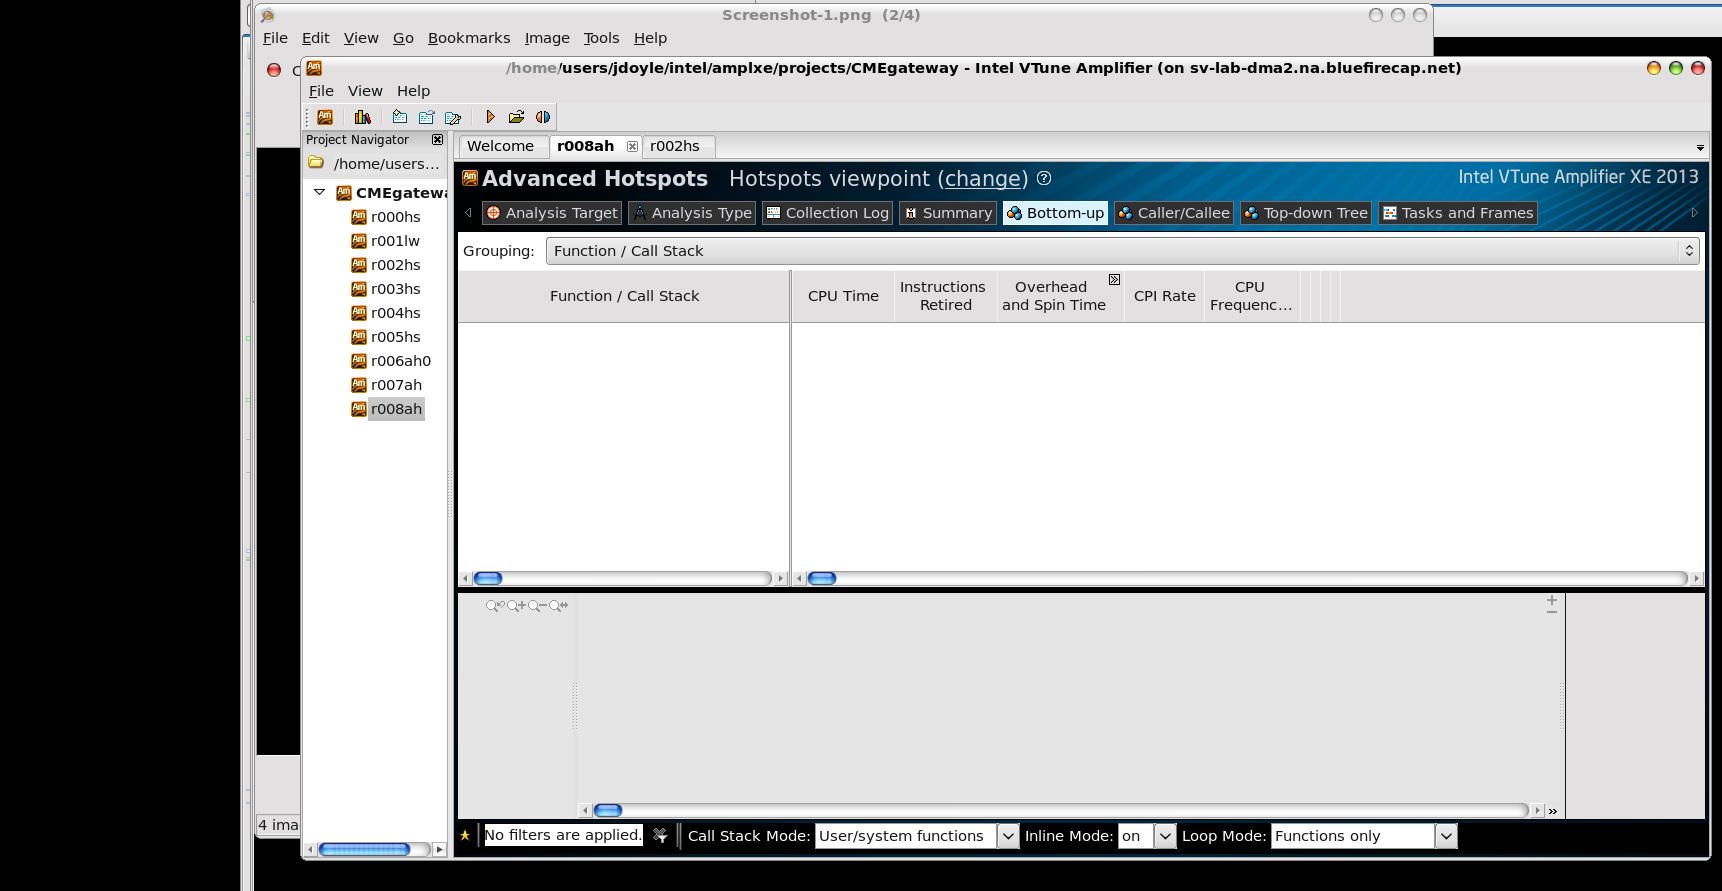
Some screenshots of the VTune GUI are attached. The distro is actually CentOS 6.4. Result Size is reported as 209MB. In the Bottom-up view, no functions are listed in the Function/Call Stack list.
- Mark as New
- Bookmark
- Subscribe
- Mute
- Subscribe to RSS Feed
- Permalink
- Report Inappropriate Content
I'm fairly certain I've tripped over a workaround.
Steps to reproduce the problem are:
- Start the application to profile
- Configure an Advanced Hotspots Analysis
- In Project Properties, set Target Type to Attach to Process, and appropriately set PID field.
- Start the profiling
- Let process being profiled exit, without stopping profiling
- VTune detects the process exiting, and automatically stops profiling
- Observe problem described in earlier post (no functions are listed in any results view)
The workaround is to change step 5, and manually stop VTune profiling, rather than letting the process exit on its own.
In that case, VTune does display results.
- Mark as New
- Bookmark
- Subscribe
- Mute
- Subscribe to RSS Feed
- Permalink
- Report Inappropriate Content
Okay, thanks, Joe! Yeah, from your screenshots I can see that something is definitely wrong. *Nothing* is being displayed! Even the Summary tab is missing almost all of the data.
I'll attempt to reproduce this and let you know what I find.
- Subscribe to RSS Feed
- Mark Topic as New
- Mark Topic as Read
- Float this Topic for Current User
- Bookmark
- Subscribe
- Printer Friendly Page