- Mark as New
- Bookmark
- Subscribe
- Mute
- Subscribe to RSS Feed
- Permalink
- Report Inappropriate Content
Hi,
I tried searching for the topic, but couldn't find much information.
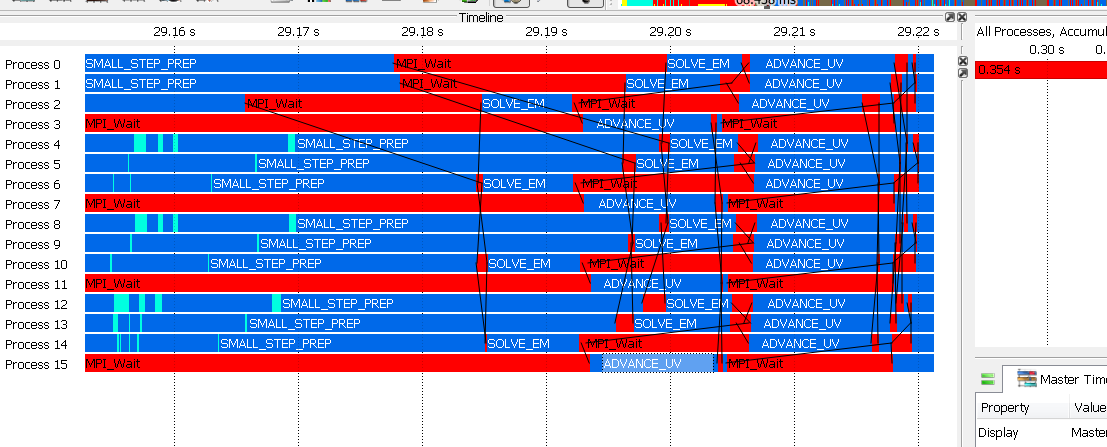
I am looking to achieve performance visualization such that I can view the parallel behavior of my application. For example, at a given point of time I would like to know which functions are being executed in each of the threads so that I can redesign my application for better usage of resources.
I have seen that kind of view with Vampir, which I am attaching for information.
 I have a feeling that it is possible with VTune, but not sure how to achieve it. Any pointers would be helpful.
Thanks.
Uday
- Mark as New
- Bookmark
- Subscribe
- Mute
- Subscribe to RSS Feed
- Permalink
- Report Inappropriate Content
Hi Uday,
The only way to provide executing function at any moment of time is dynamic/static instrumentation of all the executing functions which usually introduces very high overhead (200-1000%). VTune doesn't do full instrumentation, but instead collecting statistical hotspots via sampling approach. This allows us to remain within 5-10% of collection overhead (depending on analysis options). You can activate "Clocktick Sample" layer on the timeline (Bottom-up view) in order to get function names when sample occurs - hover mouse on green triangles in order to see details in the tooltip.
However, you can statically instrument particular functions using ITT Task API which would give you exact function boundaries on the timeline.
Threading analysis can dynamically instrument system functions related to threading and synchronization in order to represent waits, locks, transition, context switches.
When you analyze parallel efficiency, the primary metric is "CPU Utilization" which needs to be maximized. You need to decrease thread inactive time in order to increase CPU utilization and thread concurrency. Analyzing locks, transitions or context switches (Threading analysis) should give you enough data for optimization.
Link Copied
- Mark as New
- Bookmark
- Subscribe
- Mute
- Subscribe to RSS Feed
- Permalink
- Report Inappropriate Content
- Mark as New
- Bookmark
- Subscribe
- Mute
- Subscribe to RSS Feed
- Permalink
- Report Inappropriate Content
Hi Uday!
You are looking for VTune Amplifier Threading Analysis. Take a look at next help topics:
https://software.intel.com/en-us/vtune-amplifier-help-threading-analysis
https://software.intel.com/en-us/vtune-amplifier-help-threading-efficiency-view
With such analysis you are able to get stacks of every thread of your application with precision of CPU sampling interval (1 ms by default). You will be able to see synchronizations and context switches.
- Pavel
- Mark as New
- Bookmark
- Subscribe
- Mute
- Subscribe to RSS Feed
- Permalink
- Report Inappropriate Content
On screenshot I see you profiling MPI application. So I recommend to read next topic too:
https://software.intel.com/en-us/vtune-amplifier-help-mpi-code-analysis
- Pavel
- Mark as New
- Bookmark
- Subscribe
- Mute
- Subscribe to RSS Feed
- Permalink
- Report Inappropriate Content
Hi Pavel,
Thanks for the response.
I will look into the threading analysis links that you shared.
The snapshot I shared is using the sample trace files that are available in the vampir site (https://vampir.eu/downloads/tracefiles). But, I presume the bars mentioning EM_SOLVE etc are functions - not sure though.
To summarize my objective is to analyse thread-wise behavior at application level over different cores. As I mentioned earlier - "at a given point of time I would like to know which user-level-functions are being executed in each of the threads". This way, I might see a big bar in processor1/thread1 while the other processors/threads show blank. I might end up breaking that big bar (function) into parallelizable chunks.
Thanks.
Uday
- Mark as New
- Bookmark
- Subscribe
- Mute
- Subscribe to RSS Feed
- Permalink
- Report Inappropriate Content
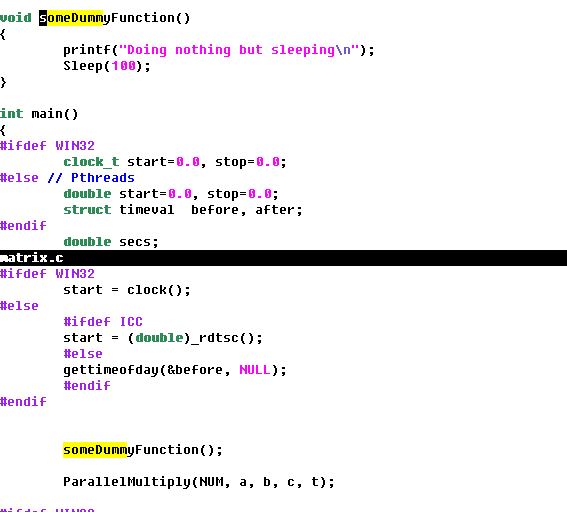
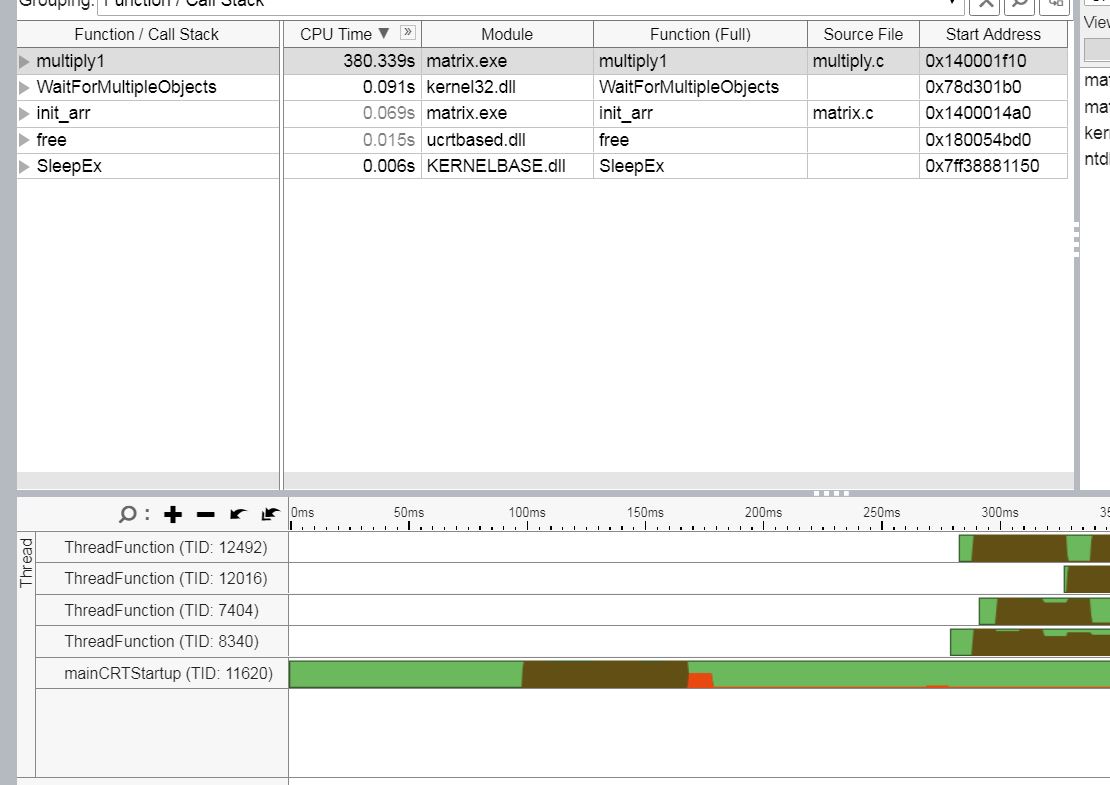
Just to make the point complete..
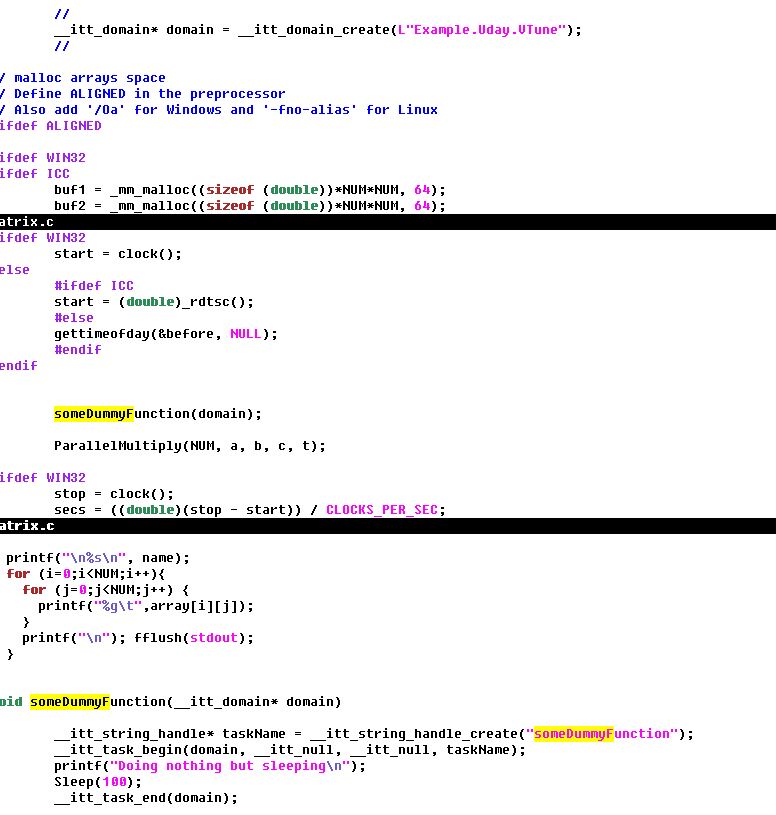
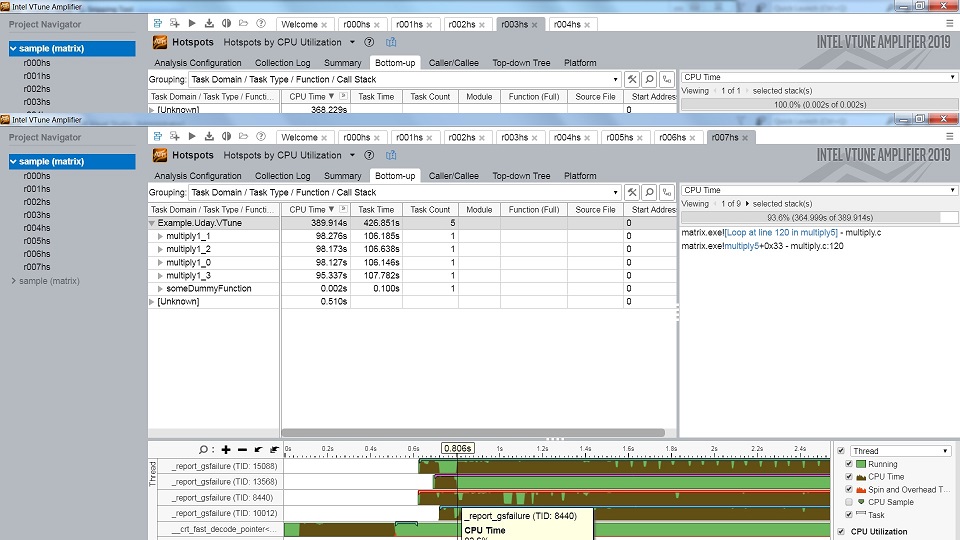
Attached are the snapshots from the Amplifier wo/ and w/ sleep which I introduced in the 'matrix' example. When I hover over the initial part of the main thread, I would like to see that it is introduced from 'someDummyFunction'. Could that be possible by manual instrumentation, if not through this automatic analysis?
- Mark as New
- Bookmark
- Subscribe
- Mute
- Subscribe to RSS Feed
- Permalink
- Report Inappropriate Content
Hi Uday,
The only way to provide executing function at any moment of time is dynamic/static instrumentation of all the executing functions which usually introduces very high overhead (200-1000%). VTune doesn't do full instrumentation, but instead collecting statistical hotspots via sampling approach. This allows us to remain within 5-10% of collection overhead (depending on analysis options). You can activate "Clocktick Sample" layer on the timeline (Bottom-up view) in order to get function names when sample occurs - hover mouse on green triangles in order to see details in the tooltip.
However, you can statically instrument particular functions using ITT Task API which would give you exact function boundaries on the timeline.
Threading analysis can dynamically instrument system functions related to threading and synchronization in order to represent waits, locks, transition, context switches.
When you analyze parallel efficiency, the primary metric is "CPU Utilization" which needs to be maximized. You need to decrease thread inactive time in order to increase CPU utilization and thread concurrency. Analyzing locks, transitions or context switches (Threading analysis) should give you enough data for optimization.
- Mark as New
- Bookmark
- Subscribe
- Mute
- Subscribe to RSS Feed
- Permalink
- Report Inappropriate Content
Hi Uday,
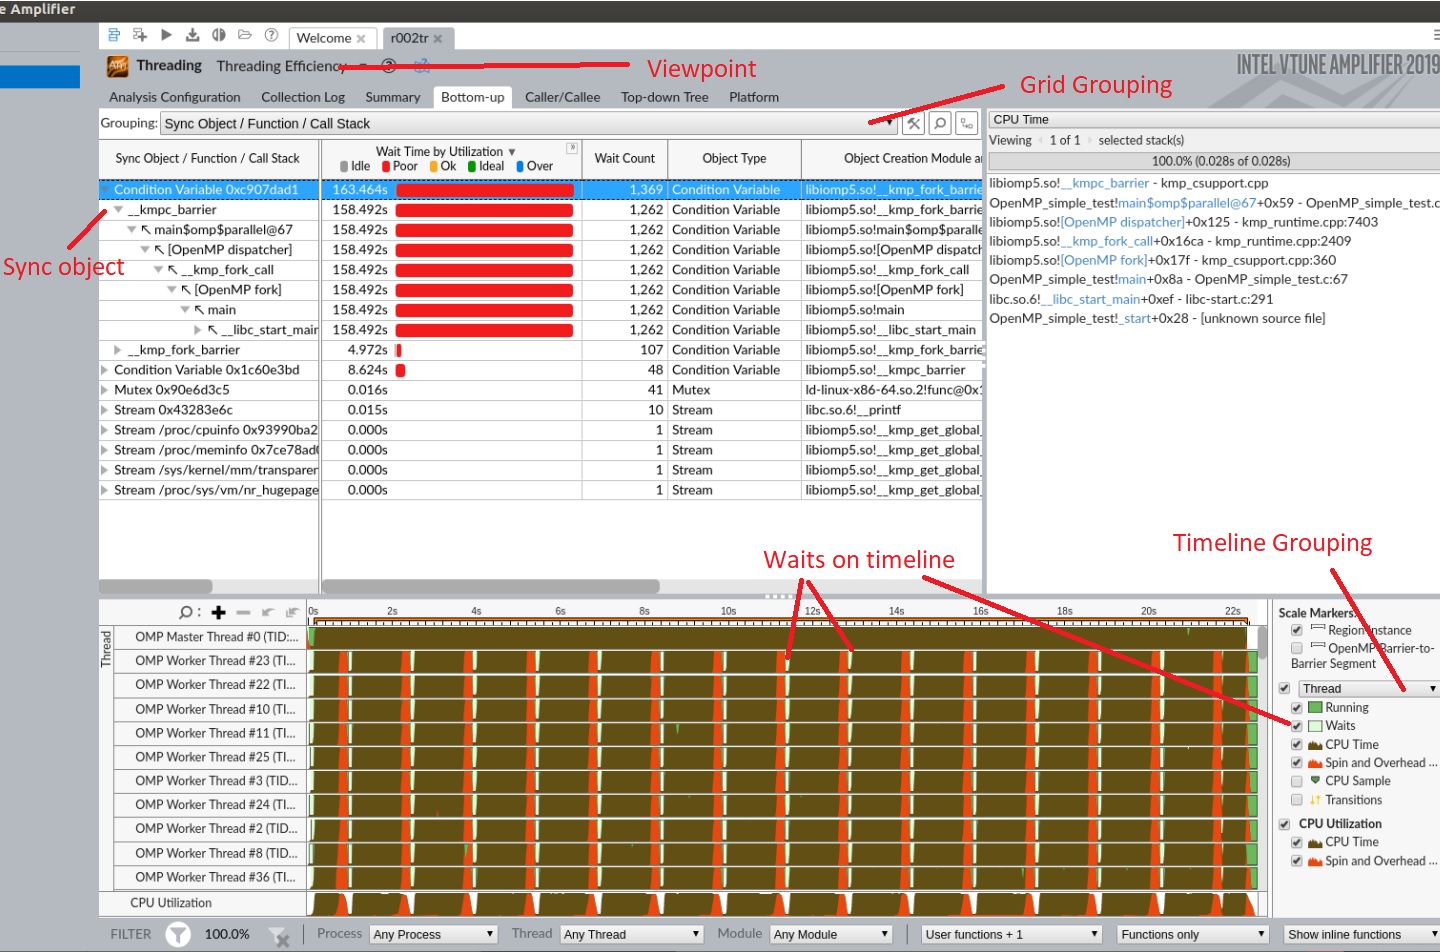
If I understand you correctly then you will need to collect Threading sw-based (user-mode) analysis (if it isn't done yet), switch to "Locks and Waits" or "Threading efficiency" viewpoint and on Bottom-up tab set "Sync Object/Function/Call Stack" grouping. In this case you will see your sync objects and wait time spending in them, synchronization objects are instrumented automatically in this analysis type.
Also waits are represented as pale green color on Timeline so you can use filter in for a period of time or filter in some object in grid to highlight what you want. I've attached a screenshot to show what I meant.
To see how such sync objects were executed along different threads you will need to chose a grouping with Thread.
If you wish to mark some specific functions that isn't marked automatically you will need to use ITT API in your code https://software.intel.com/en-us/vtune-amplifier-help-instrumentation-and-tracing-technology-apis .
Also in your screenshots I see an overtime picture of traced MPI functions. Will it be helpful for you if VTune can trace MPI functions and represent them on timeline like ITT tasks?
BR,
Vladimir
- Mark as New
- Bookmark
- Subscribe
- Mute
- Subscribe to RSS Feed
- Permalink
- Report Inappropriate Content
Hi Vitaly,
Thanks for the pointer on ITT Task API. I think this is what I was looking for.
And yes, I agree with you on the overhead with static instrumentation. That is expected I guess, but would that be that too high - especially if I want to instrument selectively, say? Not sure.
Threading analysis, in my opinion, throws some good inferences when we have parallelized the content but not in some optimized manner. This is definitely needed. But, this wouldn't give information of unintentional missing of parallelization which could be caught by seeing the function(s) boundary on the timeline.
Thanks.
Uday
- Mark as New
- Bookmark
- Subscribe
- Mute
- Subscribe to RSS Feed
- Permalink
- Report Inappropriate Content
Hi Vladimir,
Thanks for the clear instructions. Unfortunately, in the sample collection I had with me I see 'No data to show' under the grouping you mentioned. Probably I missed something while configuring the run.
But I see the same suggestion from you as well - ITT Task API, which is what I am looking for. Though I am not in the state to experiment, I can see that it is what I was intending.
And as mentioned before, the screenshot has MPI stuff because of the sample trace file I downloaded from the vampir homepage.
Thanks.
Uday
- Mark as New
- Bookmark
- Subscribe
- Mute
- Subscribe to RSS Feed
- Permalink
- Report Inappropriate Content
Hi,
Sorry for coming back with silly question, but I dont understand what I am missing.
I am working on Windows7 Enterprise and using VS2015. I just added the following line, before main:
"__itt_domain* domain = __itt_domain_create(L"Example.Uday.VTune");"
This is the compilation error I see:
"Initializer is not constant"
When I look into 'ittnotify.h' I see series of macros based on the OS etc. Anyways, I tried looking into where I could have gone wrong but couldn't find anything. It sounds like some silly mistake somewhere, but doesn't catch my eye.
Any help here?
Thanks.
Uday
- Mark as New
- Bookmark
- Subscribe
- Mute
- Subscribe to RSS Feed
- Permalink
- Report Inappropriate Content
Hi,
I think the root cause is that you have C code in terms of VS2015 (.c file) and in C language you have to initialize static object with constant expression. So as __itt_domain_create (after macro expressions) is a real call to a function placed in static part of ITT API, it cannot be used in initialization. Thus you have to move initialization later in code or convert your code to C++ for VS.
BR,
Vladimir
- Mark as New
- Bookmark
- Subscribe
- Mute
- Subscribe to RSS Feed
- Permalink
- Report Inappropriate Content
Thanks a lot Vladimir. My bad. I knew I missed something, but couldn't think if it.
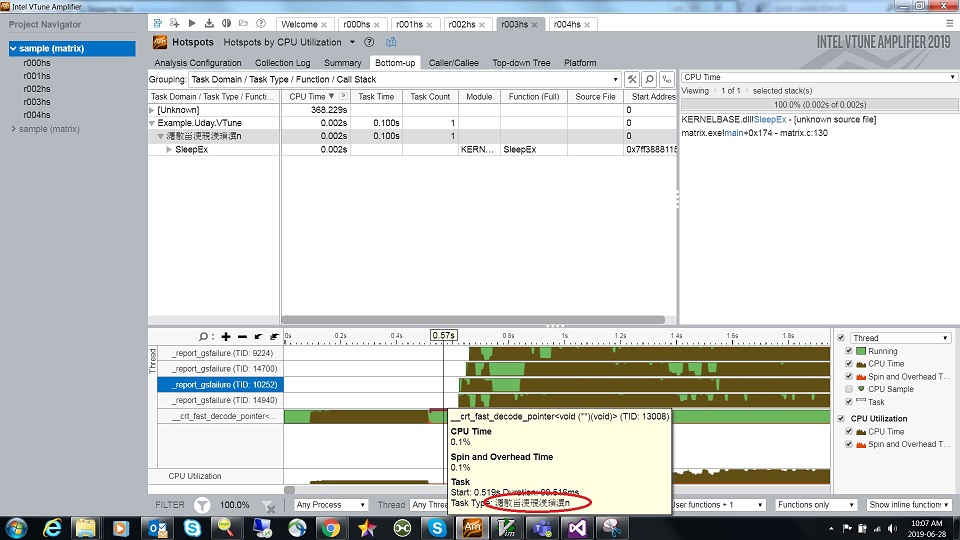
Anyways, I could finally get the function bar (basically a task from Intel's ITT perspective) which I envisioned. Attached is the image.
Unfortunately, I have one more question. Not sure what was wrong, I am seeing the 'Task Type' in some alien language. I tried Japanese/Korean/Chinese - > English using some online image translators, but no luck. It might sound a bit extreme, but tried it.
Any idea why is that? I have attached the code snippet as well.
Thanks guys for the support. I really appreciate it.
Uday
- Mark as New
- Bookmark
- Subscribe
- Mute
- Subscribe to RSS Feed
- Permalink
- Report Inappropriate Content
Hi Uday,
My assumption is the root cause is in encoding mix, i.e. you create domain using a wide character string (UTF-16 __itt_domain_create(L"Example.Uday.VTune")) and string_handle is created as single character string (ANSII __itt_string_handle_create("someDummyFunction")). Thus just make it L"".
BR,
Vladimir
- Mark as New
- Bookmark
- Subscribe
- Mute
- Subscribe to RSS Feed
- Permalink
- Report Inappropriate Content
- Mark as New
- Bookmark
- Subscribe
- Mute
- Subscribe to RSS Feed
- Permalink
- Report Inappropriate Content
Hi Vladimir,
Is it possible to filter on a particular task or a set of tasks? For example, if I have a series of algorithms processing on Data1, Data2, Data3 then I just wanted to see Data1 processing times on the timeline - like, when each of the algorithms are operating on Data1. I did try to play around with the vtune amplifier as well as searched a bit over the forums but couldn't get any lead on it.
Thanks.
Uday
- Mark as New
- Bookmark
- Subscribe
- Mute
- Subscribe to RSS Feed
- Permalink
- Report Inappropriate Content
Hi Uday,
yes, you can. You have to switch to a corresponding grouping with Tasks and filter in (context menu is available by click on right button of mouse) interested task, timeline and metrics will be recalculated automatically.
BR,
Vladimir
- Mark as New
- Bookmark
- Subscribe
- Mute
- Subscribe to RSS Feed
- Permalink
- Report Inappropriate Content
Ok, the right click ('filter in by selection'). Got it. Thanks Vladimir.
- Subscribe to RSS Feed
- Mark Topic as New
- Mark Topic as Read
- Float this Topic for Current User
- Bookmark
- Subscribe
- Printer Friendly Page